

doi: 10.1126/science.1202839.
Sleep and synaptic homeostasis: structural evidence in Drosophila
Affiliations
- PMID: 21700878
- PMCID: PMC3128387
- DOI: 10.1126/science.1202839
Item in Clipboard
Sleep and synaptic homeostasis: structural evidence in Drosophila
Science.
.
Abstract
The functions of sleep remain elusive, but a strong link exists between sleep need and neuronal plasticity. We tested the hypothesis that plastic processes during wake lead to a net increase in synaptic strength and sleep is necessary for synaptic renormalization. We found that, in three Drosophila neuronal circuits, synapse size or number increases after a few hours of wake and decreases only if flies are allowed to sleep. A richer wake experience resulted in both larger synaptic growth and greater sleep need. Finally, we demonstrate that the gene Fmr1 (fragile X mental retardation 1) plays an important role in sleep-dependent synaptic renormalization.
Figures
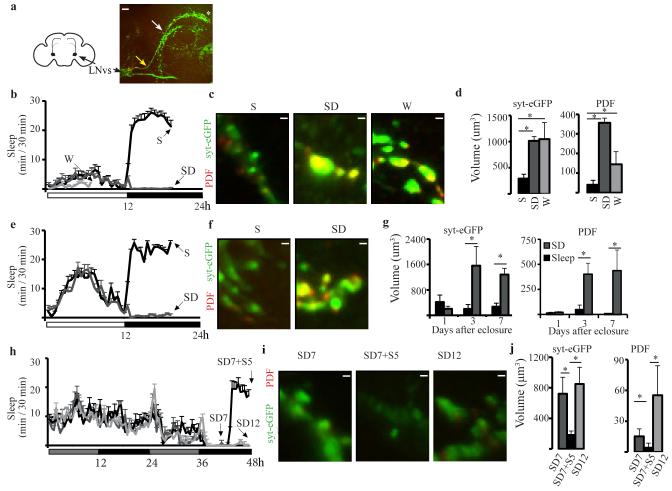
a. Left, schematic frontal section of fly brain with LNvs neurons projecting to the dorsal brain. Right, example of small LNvs axonal terminals stained for syt-eGFP (green). Yellow and white arrows point to where LNvs axons leave the posterior optic tract and to the first axonal bifurcation, respectively. Asterisk marks the tip of the terminal region whose volume was measured, as shown in c, f, i. b. Mean sleep duration in 7 day-old females used for imaging after spontaneous wake (W), sleep deprivation (SD), or sleep (S). Horizontal white and black bars indicate light and dark period, respectively. c. Examples of small LNvs axonal terminals stained for syt-eGFP (green), PDF (red, overlap yellow) and volume measurements (d) in females (S = 9, W = 9, SD = 5). e. Mean sleep duration in 7 day-old males used for imaging. f. Examples of axonal terminals in males. g. Mean volume measurements in males harvested 1, 3 and 7 days after eclosure (n = 5 / time point). h. Mean sleep duration in per01 males kept in constant darkness. At the onset of the second subjective night, flies underwent SD for 7 or 12h, or 7h SD followed by 5h of sleep. i. Examples of axonal terminals. j. Mean volume measurements (n = 7 /group). All bars = 1μm except in A (10μm). All panels show ± SEM.
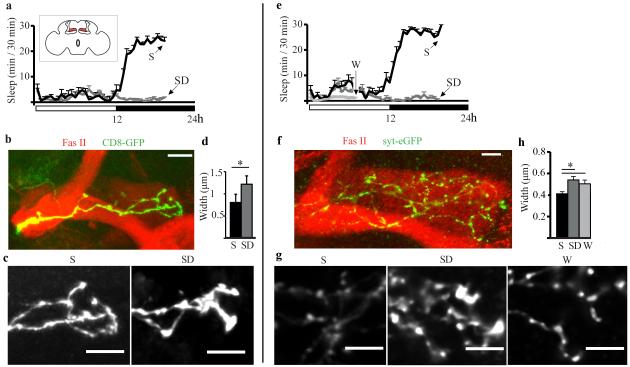
a. Mean sleep duration in female flies used for imaging after 7h of S or SD at night. Inset, schematic frontal section of the fly brain showing gamma lobes in red. b. Example of MARCM clones tagged with CD8-GFP (green), which outlines gamma lobe neurons. Fasciclin II (Fas II, red) staining outlines the mushroom bodies. c. Representative images of CD8-GFP clones from S and SD flies. d. Mean width of axonal tips (females, S = 26, SD = 15). e. Mean sleep duration in flies used for imaging after W, SD or S. f. Representative gamma lobe with two MARCM-generated clones expressing syt-eGFP (green). g. Representative syt-eGFP puncta from S, SD, and W flies. h. Mean puncta width (males and females did not differ and were pooled; S = 34, SD = 26, W = 20). Mean number of tested puncta per lobe per fly was S = 28 ± 2, SD = 29 ± 2, W = 30 ± 2. All bars = 10μm. All panels show ± SEM.
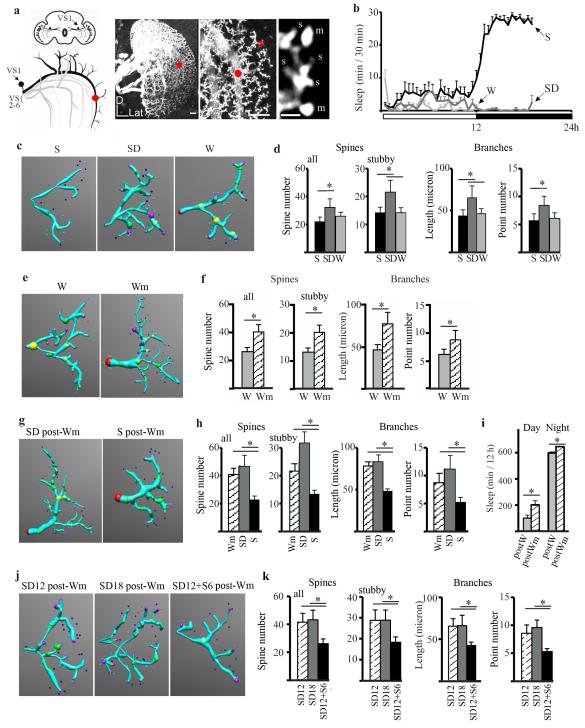
a. Left, frontal section of fly brain with VS neurons (branches and cell body are shown only for VS1, trunks are shown for all other VS neurons). Right, representative two-dimensional maximum intensity projections of three-dimensional image stacks of VS neurons (actin-GFP driven by DB331GAL4) at low and medium resolution (left and middle, bars = 10 μm) and high resolution (right, bar = 1μm). Red dot indicates the beginning of the scored branch. Red asterisk is above the region shown in the right panel. s, stubby, m, mushroom. b. Mean sleep duration in females used for imaging after W, SD, or S. c. Examples of model neurons (reconstructed using NeuroStudio (36) from S, SD, and W flies. Model shows dendritic processes as blue cylinders connecting user defined locations on the branch (large spheres) and spines (smaller spheres). d. Mean number of total and stubby spines, branch length and branch points (n = 10 flies /group). e, f. Examples of reconstructed neurons from flies awake for 12h in single tubes (W, n = 10) or in the fly mall (Wm, n = 12). g, h. Examples of reconstructed neurons from flies allowed to sleep (S postWm, n = 12) or sleep deprived (SD postWm, n = 11) after 12h in the fly mall. (Wm = 12, same flies as in f). i. Sleep time for the 24h following 12h in the fly mall (postWm, n = 76). Control flies (postW, n = 75) spent the same 12h awake in single tubes. j, k. Examples of reconstructed neurons from flies housed for 12h during the light period in the fly mall and then sleep deprived for 12h at night. Flies were then collected immediately (SD12, n = 9), sleep deprived for 6h (SD18, n = 7), or allowed to sleep for 6h (SD12 + S6, n = 10). All panels show ± SEM.
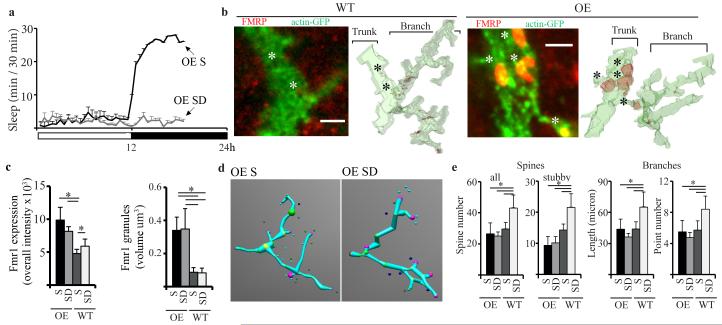
a. Mean sleep duration in OE female flies used for imaging after S and SD. b. Left, single confocal images of Fmr1 wildtype and OE VS1 neurons stained for FMRP (red) and actin-GFP (green, overlap yellow). Right, surface plots generated by segmenting the three-dimensional confocal stacks. FMRP localizes to granules clearly visible in OE but not in WT VS1 neurons. Bars = 2 μm. c. Mean overall (trunk+branch+spine regions) FMRP intensity (left), and mean granule volume (right) in WT and OE VS1 neurons. d. Examples of reconstructed neurons (as in Fig. 3c). e. Left, total and stubby spine number per branch in OE and WT harvested after S or SD. Right, mean branch length and number of branch points. All panels show ± SEM. (OE S = 9, OE SD = 8, WT S = 11, WT S = 8).
References
Publication types
MeSH terms
Substances
Grants and funding
LinkOut - more resources
Full Text Sources
Other Literature Sources
Molecular Biology Databases
Miscellaneous
