

Natural time analysis of critical phenomena
- PMID: 21700886
- PMCID: PMC3136294
- DOI: 10.1073/pnas.1108138108
Natural time analysis of critical phenomena
Abstract
A quantity exists by which one can identify the approach of a dynamical system to the state of criticality, which is hard to identify otherwise. This quantity is the variance κ(1)(≡<χ(2)> - <χ>(2)) of natural time χ, where <f(χ)> = Σp(k)f(χ(k)) and p(k) is the normalized energy released during the kth event of which the natural time is defined as χ(k) = k/N and N stands for the total number of events. Then we show that κ(1) becomes equal to 0.070 at the critical state for a variety of dynamical systems. This holds for criticality models such as 2D Ising and the Bak-Tang-Wiesenfeld sandpile, which is the standard example of self-organized criticality. This condition of κ(1) = 0.070 holds for experimental results of critical phenomena such as growth of rice piles, seismic electric signals, and the subsequent seismicity before the associated main shock.
Conflict of interest statement
The authors declare no conflict of interest.
Figures


 as a function of the number k of MCS, after an abrupt quench to close but below Tc, up to k = 104. (B) Log–log plot of A. The broken line corresponding to z = 2.165 (see ref. 20) is drawn as a guide to the eye. (C) The evolution of as a function of κ1 when |Mk| is analyzed in natural time. The average (μ) and the one standard deviation (μ ± σ) values of κ1 are drawn with the thick and thin lines. The results are obtained by 103 runs of the model for various L.
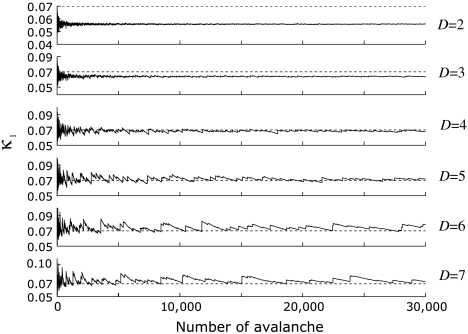
References
-
- Varotsos PA, Sarlis NV, Skordas ES. Spatio-temporal complexity aspects on the interrelation between seismic electric signals and seismicity. Pract Athens Acad. 2001;76:294–321.
-
- Varotsos PA, Sarlis NV, Skordas ES. Long-range correlations in the electric signals the precede rupture. Phys Rev E Stat Nonlin Soft Matter Phys. 2002;66:011902. - PubMed
-
- Varotsos P, Sarlis N, Skordas ES. Natural Time Analysis: The New View of Time. Berlin: Springer; 2011.
-
- Feller W. An Introduction to Probability Theory and Its Applications. Vol II. New York: Wiley; 1971.
-
- Varotsos P, Alexopoulos K. Physical properties of the variations of the electric field of the earth preceding earthquakes, I. Tectonophysics. 1984;110:73–98.
LinkOut - more resources
Full Text Sources
