

Changes in tear protein profile in keratoconus disease
- PMID: 21701529
- PMCID: PMC3178250
- DOI: 10.1038/eye.2011.105
Changes in tear protein profile in keratoconus disease
Abstract
Purpose: To analyze tear protein profile variations in patients with keratoconus (KC) and to compare them with those of control subjects.
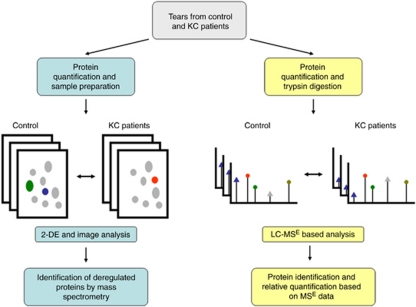
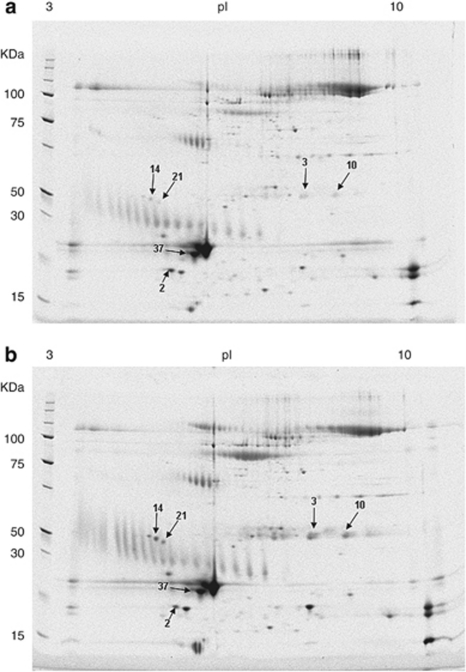
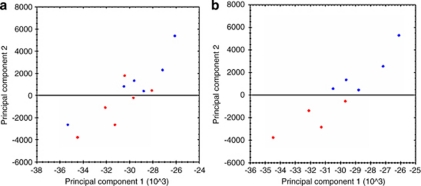
Subjects and methods: Tears from 12 normal subjects and 12 patients with KC were analyzed by two-dimensional gel electrophoresis (2-DE) and liquid chromatography-mass spectrometry (LC-MS). Analysis of the 2-DE gels was performed using Progenesis SameSpots software (Nonlinear Dynamics). Proteins exhibiting high variation in expression levels (P-value <0.05) were identified using matrix-assisted laser desorption/ionization-TOF spectrometry. For LC-MS analysis, a label-free quantification approach was used. Tears were digested with trypsin, subjected to data-independent acquisition (MS(E)) analysis, and identified proteins were relatively quantified using ProteinLynx Global Server software (Waters).
Results: The 2-DE and LC-MS analyses revealed a significant decrease in the levels of members of the cystatin family and an increase in lipocalin-1 in KC patients. A 1.43-fold decrease was observed for cystatin-S by 2-DE, and 1.69- and 1.56-fold for cystatin-SN and cystatin-SA by LC-MS, respectively. The increase in lipocalin-1 was observed by both methods with fold changes of 1.26 in the 2-DE approach and 1.31 according to LC-MS. Significant protein upregulation was also observed for Ig-κ chain C and Ig J chain proteins by 2-DE. Levels of lipophilin-C, lipophilin-A, and phospholipase A2 were decreased in tears from KC patients according to LC-MS. Serum albumin was found to be increased in KC patients according to LC-MS.
Conclusion: The results show differences in the tear protein profile of KC and control subjects. These changes are indicative of alterations in tear film stability and in interactions with the corneal surface in KC patients.
Figures
References
-
- Rabinowitz YS. Keratoconus. Surv Ophthalmol. 1998;42:297–319. - PubMed
-
- Kennedy RH, Bourne WM, Dyer JA. A 48-year clinical and epidemiologic study of keratoconus. Am J Ophthalmol. 1986;101:267–273. - PubMed
-
- Kenney MC, Nesburn AB, Burgeson RE, Butkowski RJ, Ljubimov AV. Abnormalities of the extracellular matrix in keratoconus corneas. Cornea. 1997;16:345–351. - PubMed
-
- Teng CC. Electron microscope study of the pathology of keratoconus: I. Am J Ophthalmol. 1963;55:18–47. - PubMed
-
- Iwamoto T, Devoe AG. Particulate structures in keratoconus. Arch Ophthalmol Rev Gen Ophthalmol. 1975;35:65–76. - PubMed
Publication types
MeSH terms
Substances
LinkOut - more resources
Full Text Sources
Other Literature Sources
Medical
