. 2011 Jun 24;30(15):3106-19.
doi: 10.1038/emboj.2011.206.

Genome-wide function of THO/TREX in active genes prevents R-loop-dependent replication obstacles

Affiliations

Genome-wide function of THO/TREX in active genes prevents R-loop-dependent replication obstacles

Belén Gómez-González et al. EMBO J. .

Abstract

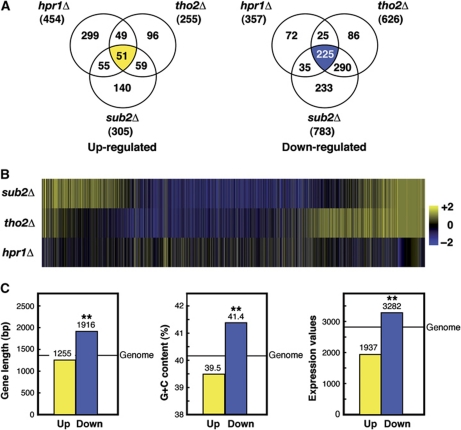
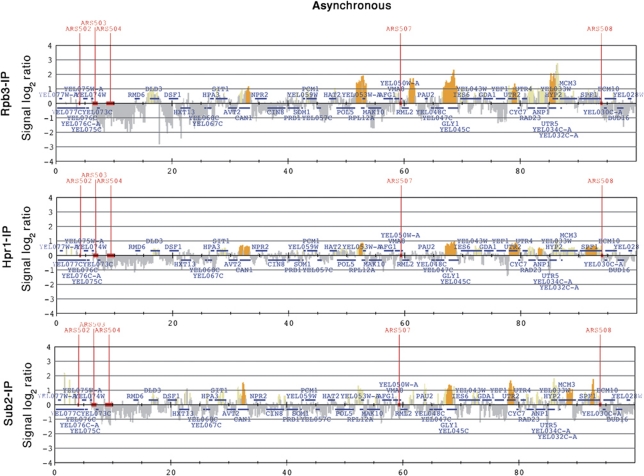
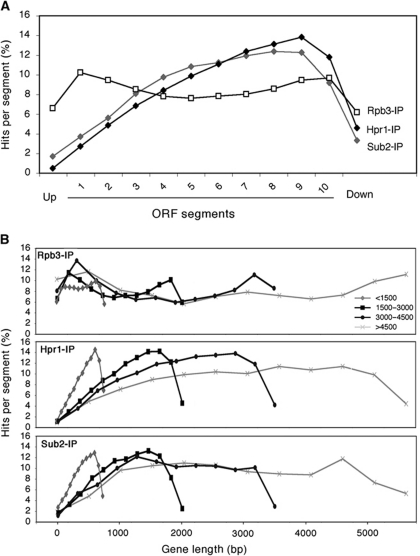
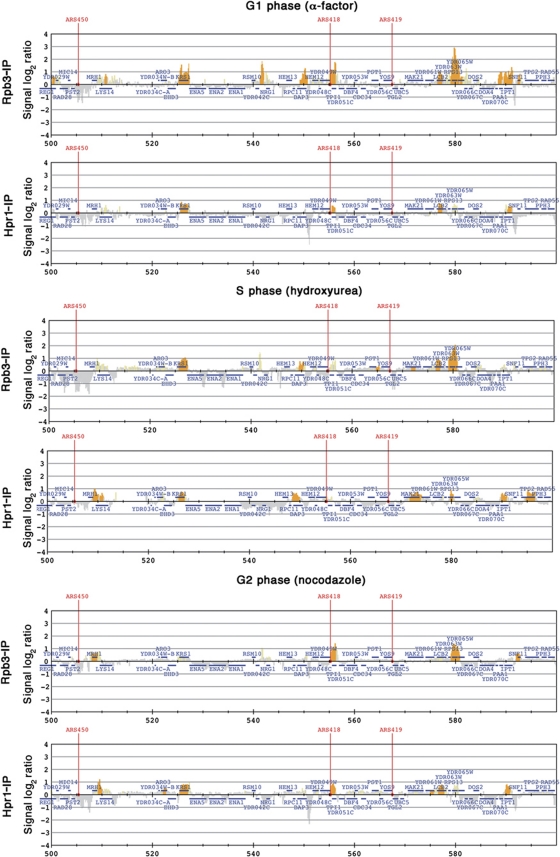
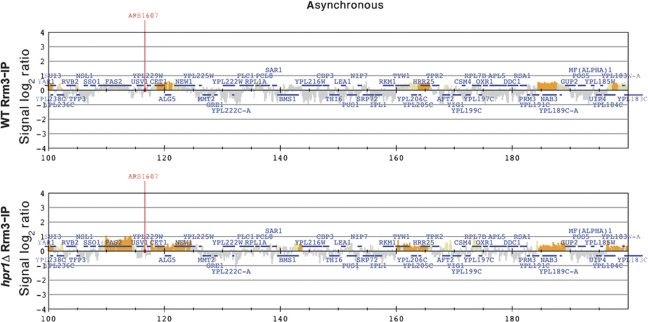
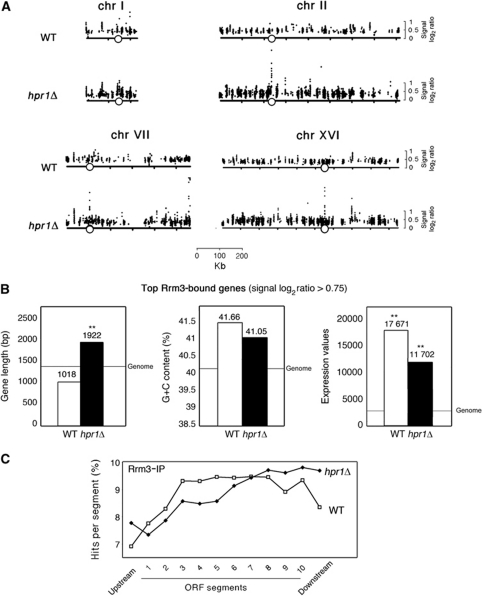
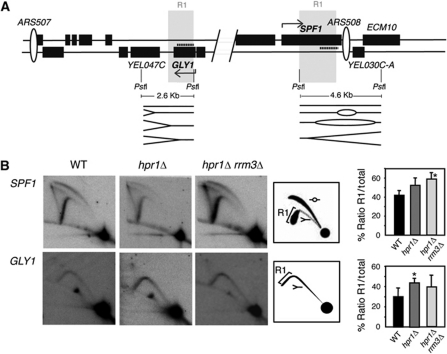
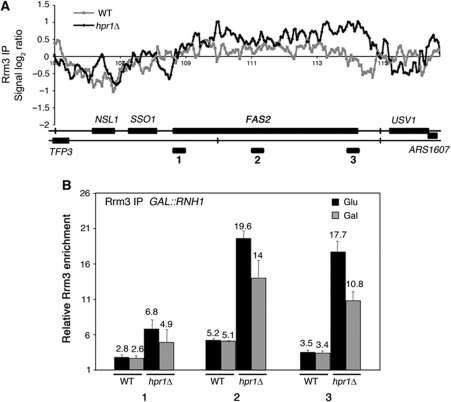
THO/TREX is a conserved nuclear complex that functions in mRNP biogenesis and prevents transcription-associated recombination. Whether or not it has a ubiquitous role in the genome is unknown. Chromatin immunoprecipitation (ChIP)-chip studies reveal that the Hpr1 component of THO and the Sub2 RNA-dependent ATPase have genome-wide distributions at active ORFs in yeast. In contrast to RNA polymerase II, evenly distributed from promoter to termination regions, THO and Sub2 are absent at promoters and distributed in a gradual 5' → 3' gradient. This is accompanied by a genome-wide impact of THO-Sub2 deletions on expression of highly expressed, long and high G+C-content genes. Importantly, ChIP-chips reveal an over-recruitment of Rrm3 in active genes in THO mutants that is reduced by RNaseH1 overexpression. Our work establishes a genome-wide function for THO-Sub2 in transcription elongation and mRNP biogenesis that function to prevent the accumulation of transcription-mediated replication obstacles, including R-loops.


Conflict of interest statement

The authors declare that they have no conflict of interest.

Figures

Figure 1
Figure 1
Comparative analysis of genes affected by the different THO–Sub2 mutations. (A) Venn diagrams representing the overlap between genes whose expression is changed in hpr1Δ, tho2Δ and sub2Δ mutants. See also Supplementary Dataset I. (B) Heatmap of genes affected by THO/TREX null mutants. The heatmap of the 50% genes with major intensities is shown. (C) Statistical analyses of length, G+C content and model-based expression values of genes whose expression levels are coincidently affected in hpr1Δ, tho2Δ and sub2Δ mutants as compared with the genome average. **P<0.0001 (Mann–Whitney U-test). See also Supplementary Figure S1.
Figure 2
Figure 2
Hpr1 and Sub2 recruitment correlates with RNAPII binding and transcription levels. Rpb3-IP (top), Hpr1-IP (middle) and Sub2-IP (bottom) histogram bars in the y axis show the average signal ratio of loci significantly enriched in the immunoprecipitated fraction along the indicated regions in log2 scale (grey), and whether they fulfil one of the P-value criteria (yellow) or both (orange) (see Materials and methods). The x axis shows the chromosomal coordinates. Positions of ARS elements are indicated. The horizontal bars mark the positions of the indicated ORFs. See also Supplementary Dataset II and Supplementary Figures S2 and S3.
Figure 3
Figure 3
THO–Sub2 recruitment increases towards the end of ORFs and at terminator regions. (A) Composite profile of Rpb3, Hpr1 and Sub2 occupancy (detected by ChIP-chip) across the average ORF plotted as Rpb3, Hpr1 and Sub2 percentage of ChIP hits per segment (see Materials and methods). (B) Composite profile of Rpb3, Hpr1 and Sub2 occupancy across the average ORF for different intervals of gene length. Other details as in (A). See also Supplementary Figures S4–S6.
Figure 4
Figure 4
Hpr1 binding correlates with RNAPII binding in every cell-cycle phase. Histogram bars of Rpb3 (top) and Hpr1 (bottom) ChIP-chip data in different cell-cycles phases: α-factor arrested for G1, hydroxyurea arrested for S and nocodazol arrested for G2. Other details as in Figure 2. See also Supplementary Dataset III and Supplementary Figure S7.
Figure 5
Figure 5
Genomic view of Rrm3 recruitment in WT and hpr1Δ mutant. Rrm3 ChIP-chip data of a region of chromosome XVI in WT (top) and hpr1Δ (bottom). Other details as in Figure 2. See also Supplementary Dataset IV and Supplementary Figure S7.
Figure 6
Figure 6
Rrm3 recruitment in highly transcribed DNA regions in WT and hpr1Δ cells. (A) Genome-wide recruitment of Rrm3 to different chromosomes in WT and hpr1Δ mutants. A representation of chromosomes I, II, VII and XVI with the signal log2 ratio values for the significant hits is plotted. The x axis shows chromosomal coordinates in kb. Positions of centromeres are indicated as open circles. See also Supplementary Figure S8. (B) Statistical analysis of length, G+C content and model-based expression values of genes showing Rrm3 recruitment with signal log2 ratios above 0.75 in WT (52 genes) or hpr1Δ cells (137 genes). Grey lines indicate the genome average value. **P<0.0001 (Mann–Whitney U-test). (C) Composite profile of Rrm3 occupancy (detected by ChIP-chip) across the average ORF plotted as percentage of hits per segment in WT or hpr1Δ cells. Other details as in Figure 3.
Figure 7
Figure 7
Replication fork analysis by 2D-gel electrophoresis. (A) Scheme of the DNA region analysed. The indicated 2.6 and 4.6 kb PstI restriction fragments were analysed for GLY1 and SPF1, respectively. Probes are indicated as dash lines. Direction of transcription is indicated with an arrow. The R1 region is shown. (B) Analysis of replication fork progression through the highly expressed GLY1 and SPF1 genes in WT, hpr1Δ and hpr1Δ rrm3Δ cells. The ratio of the signal in the descending Y arc (R1) versus the total replicating molecules (Y plus bubble arcs) is plotted on the right as a way to determine the relative delay of replication fork progression in mutant versus WT strains. One representative gel is shown for each experiment. *P<0.05 as calculated by the Student's t-test.
Figure 8
Figure 8
Rrm3 recruitment at the FAS2 gene in WT and hpr1Δ cells and effect of RNAse H1 overexpression. (A) Detailed analysis of ChIP-chip data of Rrm3-FLAG at the FAS2 region. (B) Specific Rrm3-FLAG ChIP analyses using RT–qPCR of three regions (depicted as black rectangles on A) of FAS2 in WT and hpr1Δ cells with normal and overexpressed levels of RNH1. Overexpression was achieved with plasmid pRS315-GALRNH1 under galactose conditions. See also Supplementary Figure S9.

References

    1. Abruzzi KC, Lacadie S, Rosbash M (2004) Biochemical analysis of TREX complex recruitment to intronless and intron-containing yeast genes. EMBO J 23: 2620–2631 - PMC - PubMed
    1. Aguilera A (2005) mRNA processing and genomic instability. Nat Struct Mol Biol 12: 737–738 - PubMed
    1. Aguilera A, Gómez-González B (2008) Genome instability: a mechanistic view of its causes and consequences. Nat Rev Genet 9: 204–217 - PubMed
    1. Aguilera A, Klein HL (1990) HPR1, a novel yeast gene that prevents intrachromosomal excision recombination, shows carboxy-terminal homology to the Saccharomyces cerevisiae TOP1 gene. Mol Cell Biol 10: 1439–1451 - PMC - PubMed
    1. Azvolinsky A, Dunaway S, Torres JZ, Bessler JB, Zakian VA (2006) The S. cerevisiae Rrm3p DNA helicase moves with the replication fork and affects replication of all yeast chromosomes. Genes Dev 20: 3104–3116 - PMC - PubMed

Publication types

MeSH terms