. 2011 Jun 24;30(15):3028-39.
doi: 10.1038/emboj.2011.210.

DNA methylation status predicts cell type-specific enhancer activity

Affiliations

DNA methylation status predicts cell type-specific enhancer activity

Malgorzata Wiench et al. EMBO J. .

Abstract

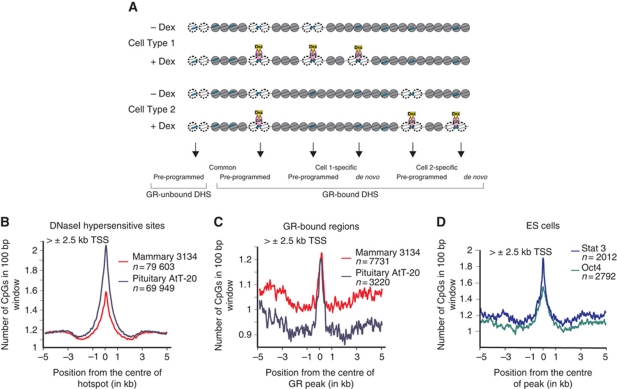
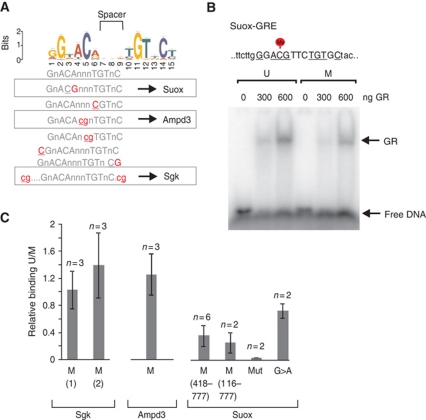
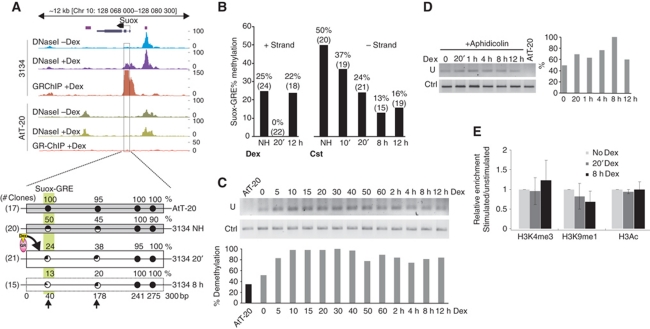
Cell-selective glucocorticoid receptor (GR) binding to distal regulatory elements is associated with cell type-specific regions of locally accessible chromatin. These regions can either pre-exist in chromatin (pre-programmed) or be induced by the receptor (de novo). Mechanisms that create and maintain these sites are not well understood. We observe a global enrichment of CpG density for pre-programmed elements, and implicate their demethylated state in the maintenance of open chromatin in a tissue-specific manner. In contrast, sites that are actively opened by GR (de novo) are characterized by low CpG density, and form a unique class of enhancers devoid of suppressive effect of agglomerated methyl-cytosines. Furthermore, treatment with glucocorticoids induces rapid changes in methylation levels at selected CpGs within de novo sites. Finally, we identify GR-binding elements with CpGs at critical positions, and show that methylation can affect GR-DNA interactions in vitro. The findings present a unique link between tissue-specific chromatin accessibility, DNA methylation and transcription factor binding and show that DNA methylation can be an integral component of gene regulation by nuclear receptors.


Conflict of interest statement

The authors declare that they have no conflict of interest.

Figures

Figure 1
Figure 1
DNaseI hypersensitive regions and GR-binding sites are characterized by an increased density of CpG dinucleotides. (A) A schematic overview describing cell type specificity of GR-binding sites (GREs, blue boxes) and DNaseI hypersensitive regions. Dex, dexamethasone. (B) All distal (>±2.5 kb) DHS sites identified by DNaseI-seq were scanned from 5 kb upstream to 5 kb downstream and the average number of CpG dinucleotides was determined for 3134 and AtT-20 cell lines. The average density of CpG dinucleotides for all DHSs as well as for a subset of DHSs exclusive of CpG islands is shown in Supplementary Figure S1 (n, number of sites analysed in each group). (C) The same analysis was performed for GR-bound regions identified by GR ChIP-seq and located 2.5 kb away from the TSS. All GR-binding sites and GR-binding sites outside of CpG islands were also analysed and showed similar distribution of CpGs (Supplementary Figure S2). (D) Oct4 and Stat3 binding sites are also enriched in CpG dinucleotides. Binding data were from data sets previously published (Chen et al, 2008) and available in GEO Database ID no. GSE11431.
Figure 2
Figure 2
Pre-programmed and de novo DNaseI hypersensitive sites have different CpG contents. (A) Chromatin organization around the GR-activated gene (Arrdc2) in 3134 cell line. DHSs were identified by DNaseI-seq and GR binding by ChIP-seq. The 5′ end of the gene overlaps with a CpG island (black box) with an extensive open chromatin structure present before (upper track, light blue) and after (middle track, dark blue) Dex stimulation. Two enhancer elements located downstream from the transcribed region are marked by GR binding (bottom track, red) and exemplify two different patterns of CpG distribution (black bars): widespread enrichment for the pre-programmed DHSs (Arrdc2-R1) and scarce CpGs at the de novo sites (Arrdc2-R2). (B) CpG density was analysed separately for the subsets of pre-programmed and de novo DHSs that overlap with GR binding in 3134 mammary epithelial cells (n, number of sites analysed in each group). (C) Comparison of CpG enrichment between GR-bound pre-programmed DHSs unique to 3134 and shared with AtT-20. To balance the difference in number of observations bootstrapping was applied (s.d. shown by dotted line). (D) Distribution of CpGs ±5 kb from the centre of GR peak in three subgroups with low, medium and high CpG density of pre-programmed sites or (E) de novo sites.
Figure 3
Figure 3
Cytosine demethylation marks the regions of chromatin transition and correlates with GR binding in a cell type-specific manner. DNA was extracted from untreated 3134 and AtT-20 cells and analysed by bisulphite sequencing. The following pre-programmed DHSs are shown: (A) Per1-R1, shared by 3134 and AtT-20; (B) Dusp1, 3134-specific; (C) Arhegf3, AtT-20-specific and (D) de novo, 3134-specific DHS site (Tsc22d3). Additional examples are shown in Supplementary Figures S3 and S5. The GR-binding profile (red track) is shown with reference to the gene location and position of CpG island (black boxes). Black frames indicate the GR-binding site analysed further by bisulphite sequencing. The distribution of CpGs (vertical lines), location of a GRE (green oval) and region covered by bisulphite sequencing (restricted by arrows) are shown below the GR-ChIP track. The CpG density is indicated (# of CpGs/100 bp) . The bisulphite sequencing results are described as follows: each line represents one clone with CpGs shown as open (unmethylated) or filled (methylated) dots and CpG number indicated on the bottom; the green bars show the position of GREs; the left side of each graph shows the DHS-seq and GR ChIP-seq tracks for the regions being queried. (D) CpG methylation pattern of Sgk regulatory elements reflects their tissue-specific utilization. The three upper tracks represent the treated (Dex, 1 h) and untreated DHS profiles and GR ChIP-seq profile detected in 3134 cells; the three lower tracks are specific for AtT-20 cells. The results of bisulphite sequencing of the three GR-binding regions (Sgk-R1: 3134 specific, de novo; Sgk-R2: AtT-20 specific, pre-programmed; Sgk-R3: common, de novo in 3134 and pre-programmed in AtT-20) are compared between 3134 and AtT-20 cells and presented as above. In (D, E), the differentially methylated CpGs, with at least 35% difference in methylation levels between the two cell lines are marked (*).
Figure 4
Figure 4
Dnmt1 depletion increases the accessibility of previously methylated regions without impacting GR binding. (A) DNA demethylation was accomplished in 3134 cells by transfection with siRNA to Dnmt1. Increase in chromatin accessibility was monitored by FAIRE at AtT-20-specific DHS sites and compared with the level of accessibility observed in AtT-20 cells (left panel). Additionally, changes in partially methylated 3134-specific de novo elements are shown (middle panel). The unmethylated, pre-programmed regions are used as control sites (right panel). (B) ChIP–qPCR using GR antibody at AtT-20-specific (left panel) and 3134-specific, de novo (right panel) regulatory elements. The results show the normalized enrichment above untreated samples (NH) from three independent experiments (or two independent experiments in AtT-20 cells shown at left panel, Figure 4A). Error bars indicate s.e.m.
Figure 5
Figure 5
GR binding can be directly affected by CpG methylation. (A) The position weight matrix for GREs derived from the global GR-binding data. The locations of possible substitutions (highlighted) leading to an occurrence of CpG site are shown. (B) EMSA gel shift assays were carried out with titrated amounts of purified GR fragment (418–777aa) and 32P-labelled probe for Suox-GRE, either unmethylated or methylated at the indicated position. (C) The quantified results of independent gel shift experiments comparing three naturally occurring GREs (Sgk, Ampd3, Suox; representative gels are shown in Supplementary Figure S8E) (mean values±s.d., n=2–6); M, methylated. For Suox-GRE, similar results were obtained by repeating the experiment with bigger GR fragment (116–777aa). The oligo probes with mutations disrupting Suox-GRE motif (mut) or mutation disrupting CpG element within Suox-GRE and reversing to a perfect motif (G>A) were used as controls.
Figure 6
Figure 6
GR-binding site is subject to rapid hormone-dependent demethylation. (A) Localization of GR-binding site within the first exon of Suox gene shows an overlap with 3134-specific de novo DHS. Below: Schematic representation of DNA methylation status across the Suox GR-binding site as detected on the negative DNA strand. DNA encompassing 300 bp and four CpGs were PCR amplified and sequenced. Each circle represents a CpG dinucleotide in relation to GRE location (vertical box), with indicated percent of methylation and number of analysed clones shown to the left. Grey narrow rectangles, closed chromatin; white wide rectangles, open chromatin; dotted lines, unknown chromatin accessibility. (B) In vivo, bisulphite sequencing analysis of Suox-GRE shows tissue-specific and hormone-triggered demethylation of a CpG located within core GRE. DNA methylation changes within Suox-GRE were detected on both positive and negative DNA strands after treatment with with 100 nM Dex (left graph) or 1 μM corticosterone, Cst (right graph) for the indicated time. The number of analysed clones is shown above each bar. (C) Extended time course analysis of DNA methylation by MS-PCR on bisulphite-treated genomic DNA. PCR was performed with primers for negative DNA strand recognizing converted unmethylated cytosine (U) or with methylation-insensitive primers (Ctrl). Lower panel shows quantified and normalized data. DNA from AtT-20 cells served as a methylated control. (D) DNA methylation changes observed at the presence of cell-cycle block with aphidicolin (1 μM). (E) ChIP–qPCR analysis of untreated and Dex-treated (20 min and 8 h) 3134 cells with the antibodies as indicated and primers encompassing Suox GR-binding site (mean values±s.d., n=3).

References

    1. Angrisano T, Sacchetti S, Natale F, Cerrato A, Pero R, Keller S, Peluso S, Perillo B, Avvedimento VE, Fusco A, Bruni CB, Lembo F, Santoro M, Chiariotti L (2010) Chromatin and DNA methylation dynamics during retinoic acid-induced RET gene transcriptional activation in neuroblastoma cells. Nucleic Acids Res 38: 1993–2006 - PMC - PubMed
    1. Antequera F, Macleod D, Bird AP (1989) Specific protection of methylated CpGs in mammalian nuclei. Cell 58: 509–517 - PubMed
    1. Auerbach RK, Euskirchen G, Rozowsky J, Lamarre-Vincent N, Moqtaderi Z, Lefrancois P, Struhl K, Gerstein M, Snyder M (2009) Mapping accessible chromatin regions using Sono-Seq. Proc Natl Acad Sci USA 106: 14926–14931 - PMC - PubMed
    1. Ball MP, Li JB, Gao Y, Lee JH, Leproust EM, Park IH, Xie B, Daley GQ, Church GM (2009) Targeted and genome-scale strategies reveal gene-body methylation signatures in human cells. Nat Biotechnol 27: 361–368 - PMC - PubMed
    1. Barski A, Cuddapah S, Cui K, Roh TY, Schones DE, Wang Z, Wei G, Chepelev I, Zhao K (2007) High-resolution profiling of histone methylations in the human genome. Cell 129: 823–837 - PubMed

Publication types