. 2011;6(6):e21158.
doi: 10.1371/journal.pone.0021158. Epub 2011 Jun 20.

Using regulatory and epistatic networks to extend the findings of a genome scan: identifying the gene drivers of pigmentation in merino sheep

Affiliations

Using regulatory and epistatic networks to extend the findings of a genome scan: identifying the gene drivers of pigmentation in merino sheep

Elsa García-Gámez et al. PLoS One. 2011.

Abstract

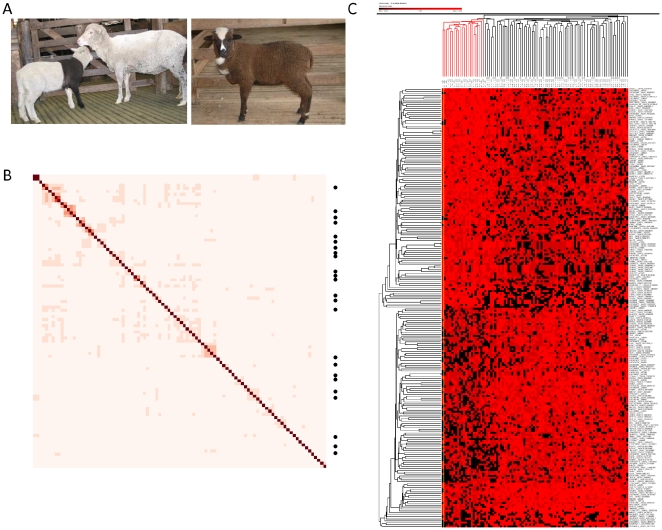
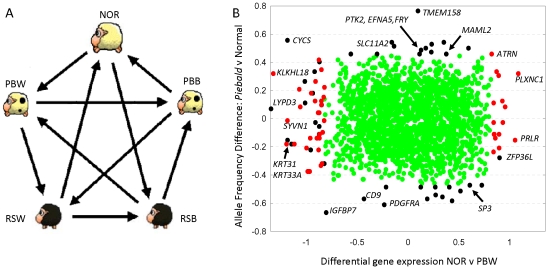
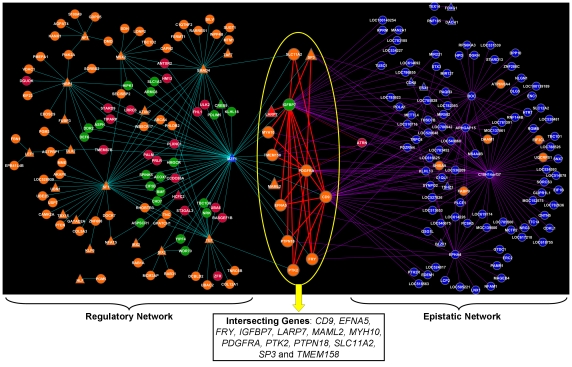
Extending genome wide association analysis by the inclusion of gene expression data may assist in the dissection of complex traits. We examined piebald, a pigmentation phenotype in both human and Merino sheep, by analysing multiple data types using a systems approach. First, a case control analysis of 49,034 ovine SNP was performed which confirmed a multigenic basis for the condition. We combined these results with gene expression data from five tissue types analysed with a skin-specific microarray. Promoter sequence analysis of differentially expressed genes allowed us to reverse-engineer a regulatory network. Likewise, by testing two-loci models derived from all pair-wise comparisons across piebald-associated SNP, we generated an epistatic network. At the intersection of both networks, we identified thirteen genes with insulin-like growth factor binding protein 7 (IGFBP7), platelet-derived growth factor alpha (PDGFRA) and the tetraspanin platelet activator CD9 at the kernel of the intersection. Further, we report a number of differentially expressed genes in regions containing highly associated SNP including ATRN, DOCK7, FGFR1OP, GLI3, SILV and TBX15. The application of network theory facilitated co-analysis of genetic variation with gene expression, recapitulated aspects of the known molecular biology of skin pigmentation and provided insights into the transcription regulation and epistatic interactions involved in piebald Merino sheep.


Conflict of interest statement

Competing Interests: The authors have declared that no competing interests exist.

Figures

Figure 1
Figure 1. Genome wide association for piebald.
(A) A piebald lamb is pictured with its non-pigmented mother (left hand side). The asymmetrical presentation of pigmentation (the lamb has one pigmented and one white forelimb) characterises this colour morph from Recessive Black (right hand side) which arises through action of the Agouti locus . (B) The genetic relationship between 24 piebald animals and 72 non-pigmented controls. Allele sharing, or genetic similarity, was calculated between each pair-wise combination of animal using 48,686 SNP. Increasing values of allele sharing are represented using darker colour. Unsupervised hierarchical clustering distributed the piebald cases (indicated with a dot) across the matrix, reflecting the sampling strategy used to select controls which were as closely related to cases as possible. (C) Unsupervised hierarchical clustering of the 226 associated SNP (P<0.001) successfully distinguished all piebald animals as genetically distinct from the controls. Animals are arranged into columns and annotated above the matrix using either red (piebald) or black lines (controls). The 226 associated SNP are arranged into rows and each cell indicates the observed genotypic outcome as follows: homozygote (bright red), heterozygote (dark red), alternate homozygote (black).
Figure 2
Figure 2. Gene expression relating to pigmentation.
(A) Design of the microarray experiment, showing hybridizations (arrows) between five tissue types. Samples were labelled with either red (arrow head) or green dye (arrow tail) and the experiment was repeated in a dye swap using samples from independent biological replicates. A total of 20 hybridizations were performed to compare the following tissue types: white skin tissue from 4 pooled non-pigmented animals (NOR); black skin tissue from a piebald animal (PBB); white skin tissue from a piebald animal (PBW); black skin tissue from a recessive black animal (RSB) and white skin tissue sampled from the inguinal, non-pigmented area from a recessive black animal (RSW). Each sample intervened in four hybridizations (two labelled red and two labelled green). (B) Plot of SNP allele frequency difference between piebald and normal animals (Y-axis) and differential gene expression in contrast 3 (NOR versus PBW) (X-axis) for a set of 1,935 genes. Red symbols represent genes which were both differentially expressed (piebald versus normal) and have a SNP within 2.5 Kb. Black symbols represent genes which either displayed differential expression (P<0.01) or are located within 1 Mb of an associated SNP. The remaining green symbols represent genes which were neither differentially expressed nor located near associated SNP.
Figure 3
Figure 3. Regulatory and epistatic networks.
Promoter sequence analysis of piebald-associated genes (Table S1) was performed to identify transcription factors (TF; represented by triangles) and build a regulatory network (left panel). Two-loci models for all pairwise comparisons among piebald-associated SNPs were fitted to develop an epistatic network (right panel). The overall landscape revealed the presence of thirteen genes located at the intersection of both networks: CD9, EFNA5, FRY, IGFBP7, LARP7, MAML2, MYH10, PDGFRA, PTK2, PTPN18, SLC11A2, SP3 and TMEM158. Gene color indicates over-expression (red), under-expression (green), unchanged expression (orange) and genes not represented on the microarray (blue) in highly correlated contrasts (DE3, DE5 and DE6). The network file (*.cys) is available on request from the authors to explore within Cytoscape .

References

    1. Charlier C, Coppieters W, Rollin F, Desmecht D, Agerholm JS, et al. Highly effective SNP-based association mapping and management of recessive defects in livestock. Nat Genet. 2008;40:449–454. - PubMed
    1. Becker D, Tetens J, Brunner A, Bürstel D, Ganter M, et al. Microphthalmia in Texel sheep is associated with a missense mutation in the paired-like homeodomain 3 (PITX3) gene. PLoS One. 2010;5:e8689. - PMC - PubMed
    1. Parker HG, Shearin AL, Ostrander EA. Man's best friend becomes biology's best in show: genome analyses in the domestic dog. Annu Rev Genet. 2010;44:309–36. - PMC - PubMed
    1. Boyko AR, Quignon P, Li L, Schoenebeck JJ, Degenhardt JD, et al. A simple genetic architecture underlies morphological variation in dogs. PLoS Biol. 2010;8:e1000451. - PMC - PubMed
    1. Yang J, Benyamin B, McEvoy BP, Gordon S, Henders AK, et al. Common SNPs explain a large proportion of the heritability for human height. Nat Genet. 2010;42:565–569. - PMC - PubMed

Publication types

MeSH terms

Substances