. 2011;6(6):e20678.
doi: 10.1371/journal.pone.0020678. Epub 2011 Jun 20.

Diffusion MRI of structural brain plasticity induced by a learning and memory task

Affiliations

Diffusion MRI of structural brain plasticity induced by a learning and memory task

Tamar Blumenfeld-Katzir et al. PLoS One. 2011.

Abstract

Background: Activity-induced structural remodeling of dendritic spines and glial cells was recently proposed as an important factor in neuroplasticity and suggested to accompany the induction of long-term potentiation (LTP). Although T1 and diffusion MRI have been used to study structural changes resulting from long-term training, the cellular basis of the findings obtained and their relationship to neuroplasticity are poorly understood.

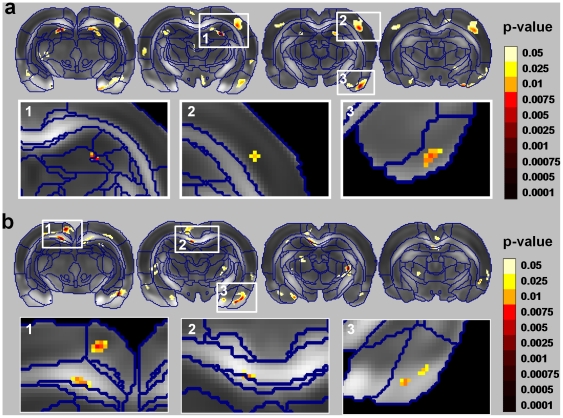
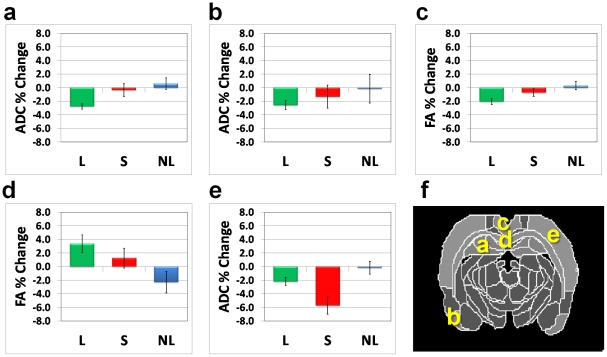
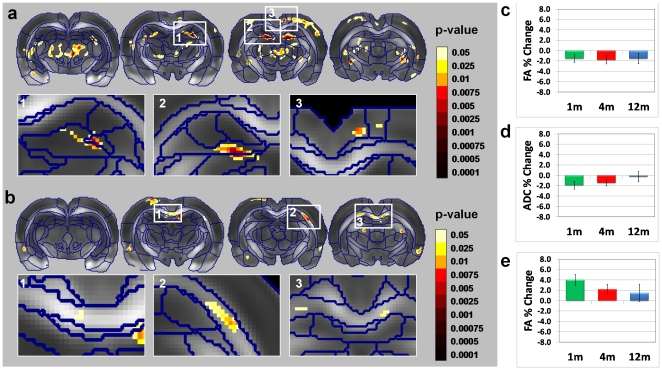
Methodology/principal finding: Here we used diffusion tensor imaging (DTI) to examine the microstructural manifestations of neuroplasticity in rats that performed a spatial navigation task. We found that DTI can be used to define the selective localization of neuroplasticity induced by different tasks and that this process is age-dependent in cingulate cortex and corpus callosum and age-independent in the dentate gyrus.

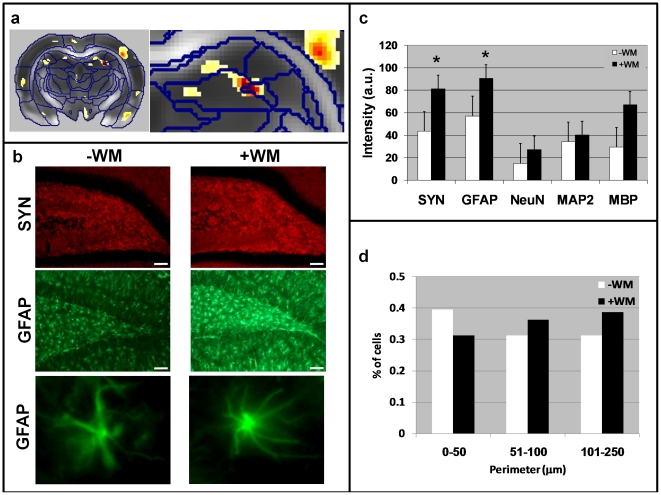
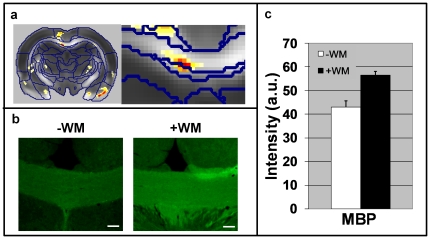
Conclusion/significance: We relate the observed DTI changes to the structural plasticity that occurs in astrocytes and discuss the potential of MRI for probing structural neuroplasticity and hence indirectly localizing LTP.


Conflict of interest statement

Competing Interests: The authors have declared that no competing interests exist.

Figures

Figure 1
Figure 1. Statistical parametric maps of the interactions between scan time and study group [learning (L), swimming only (S) and nonlearning (NL)] for (a) the apparent diffusion coefficient (ADC) and (b) the fractional anisotropy (FA).
The statistical maps (colored regions) are superimposed on an averaged FA map of all rats that were scanned, with borders of the different anatomical regions outlined in blue (see Methods). Voxels that exceed a statistical threshold of P<0.05 (non-corrected) are colored according to the threshold they exceeded (see color scale), while those that did not exceed the threshold are not colored. We report only on regional clusters that exceeded a statistical threshold of P<0.05 corrected for multiple comparisons; these regions are shown in the insets. These regions include the dentate gyrus (DG), piriform cortex (PC), and S1/S2 cortex (SC) in the ADC maps (a), and the corpus callosum (CC) and PC in the FA maps (b).
Figure 2
Figure 2. Regional analysis of the parametric interaction maps.
Type 1 of interaction, i.e., regions that exhibit significant changes in the learning group (L) only were identified in ADC in the dentate gyrus (a) and piriform cortex (b) and FA in the cingulate cortex (c) and corpus callosum (d). Type 2 of interaction, i.e., regions that exhibit significant changes in the swimming-only (S) group and to lesser extent in the learning (L) group was found in the S1/S2 cortex (e). (f) Brain atlas diagram with the abovementioned regions indicated.
Figure 3
Figure 3. Geometrical and histological analyses of the dentate gyrus and hippocampus in representative mice from group L.
(a) Statistical parametric map of interaction between scan time and group in a representative slice that includes the hippocampus and dentate gyrus (DG) region. An enlargement of this region is shown on the right. (b) Immunohistochemical staining (×10 magnification) of the cell layer of the DG and hippocampal hilus for synaptophysin (SYN, a marker of synapses) in red, and glial fibrillary acidic protein (GFAP, a marker of astrocytes) in green. Note the increase in SYN and GFAP immunoreactivity in the hilus of the DG after completion of the water maze task. GFAP immunoreactivity in the cellular layer of the DG was also increased following the task. The white bar at the bottom right corner represents 100 µm. The bottom panel of (b) shows enlargements of two representative astrocytes, demonstrating the massive structural changes that occurred in this cell type in this study group. (c) Quantification of the immunoreactivity (staining intensity) in the hilus of the DG for different markers shows significant increases in SYN and GFAP staining. Asterisk (*) denotes P<0.05. (d) Histogrammatic analysis of the perimeters of GFAP-stained cells in the hilus of the hippocampus. After completion of the water maze task there were fewer astrocytes with small perimeters and more astrocytes with large perimeters indicative of more numerous processes.
Figure 4
Figure 4. Histological analysis of the corpus callosum in representative mice from group L.
(a) Statistical parametric maps of interaction between scan time and group in a representative slice that includes the corpus callosum (CC). An enlargement of this region is shown on the right. (b) Immunohistochemical staining (×10 magnification) of the CC for MBP. Note the increase in MBP immuno-reactivity in the CC after completion of the water maze task. The white bar at the bottom right corner represents 100 µm. (c) Quantification of the immunoreactivity (staining intensity) in the CC. Asterisk denotes P<0.05.
Figure 5
Figure 5. Age dependency of the changes in diffusion tensor imaging induced by spatial learning.
(a) and (b) Statistical parametric maps of the scan time main effect over the three group L subgroups (rats that underwent the water maze task at the age of 1, 4, or 12 months) for ADC and FA, respectively. Voxels that exceed a statistical threshold of P<0.05 (non-corrected) are colored according to the threshold they exceeded (see color scale), while those that did not exceed the threshold are not colored. We report only on regional clusters that exceeded a statistical threshold of P<0.05 corrected for multiple comparisons (using the FDR method); these regions are shown in the insets. The regional pattern of the main effect (in both the ADC and the FA maps) includes the dentate gyrus (DG) and cingulate cortex as well as the corpus callosum. Post-hoc analysis of the main effects revealed that in some regions the magnitude of DTI changes between the two scans was similar across ages. Examples are reduction in ADC in the in the DG (c). Other regions show an age-dependent relationship in which effects were more pronounced in younger than in older mice. This was observed in the CG (d) and the corpus callosum (e).

References

    1. Bruel-Jungerman E, Davis S, Laroche S. Brain plasticity mechanisms and memory: a party of four. Neuroscientist. 2007;13:492–505. - PubMed
    1. Lamprecht R, LeDoux J. Structural plasticity and memory. Nat Rev Neurosci. 2004;5:45–54. - PubMed
    1. Kaplan MS, Hinds JW. Neurogenesis in the adult rat: electron microscopic analysis of light radioautographs. Science. 1977;197:1092–1094. - PubMed
    1. Gross CG. Neurogenesis in the adult brain: death of a dogma. Nat Rev Neurosci. 2000;1:67–73. - PubMed
    1. Gould E, Tanapat P, Rydel T, Hastings N. Regulation of hippocampal neurogenesis in adulthood. Biol Psychiatry. 2000;48:715–720. - PubMed

Publication types