. 2008 Sep:9:1981-2014.

Mixed Membership Stochastic Blockmodels

Affiliations

Mixed Membership Stochastic Blockmodels

Edoardo M Airoldi et al. J Mach Learn Res. 2008 Sep.

Abstract

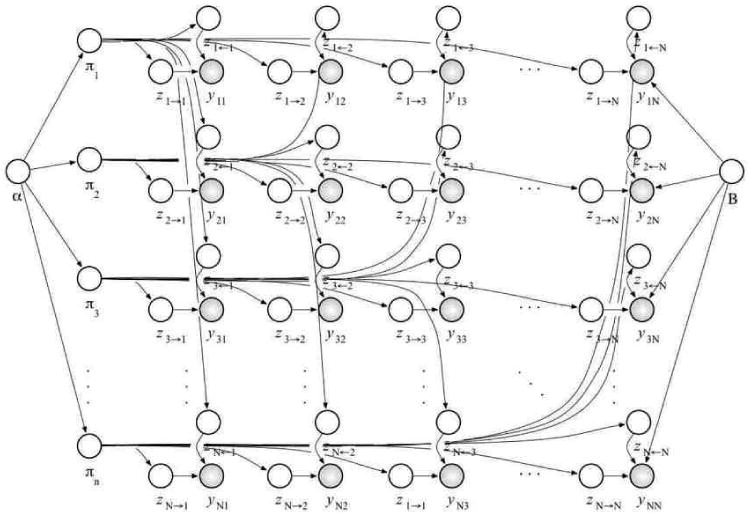
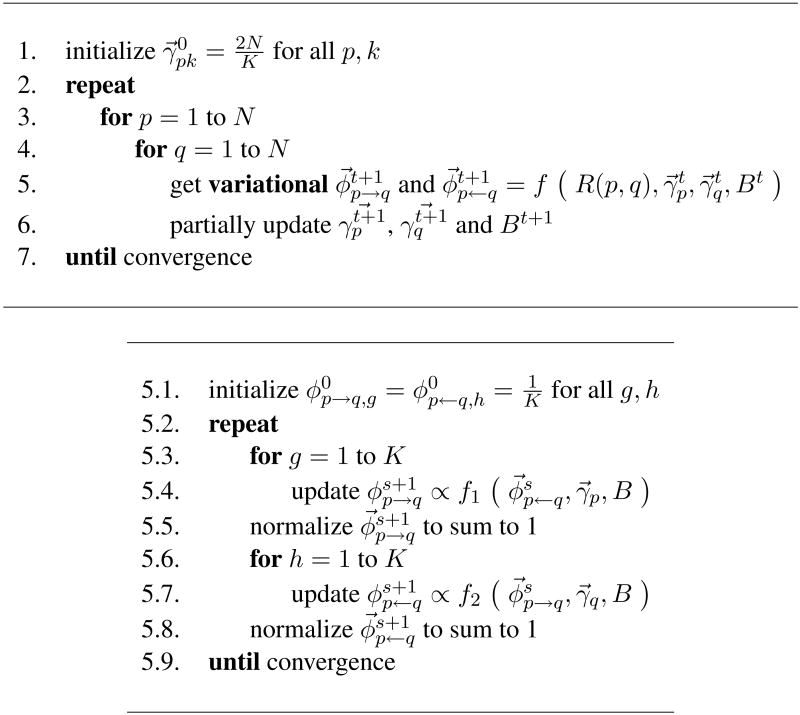
Observations consisting of measurements on relationships for pairs of objects arise in many settings, such as protein interaction and gene regulatory networks, collections of author-recipient email, and social networks. Analyzing such data with probabilisic models can be delicate because the simple exchangeability assumptions underlying many boilerplate models no longer hold. In this paper, we describe a latent variable model of such data called the mixed membership stochastic blockmodel. This model extends blockmodels for relational data to ones which capture mixed membership latent relational structure, thus providing an object-specific low-dimensional representation. We develop a general variational inference algorithm for fast approximate posterior inference. We explore applications to social and protein interaction networks.


Figures

Figure 1
Figure 1
A graphical model of the mixed membership stochastic blockmodel. We did not draw all the arrows out of the block model B for clarity. All the interactions R(p, q) depend on it.
Figure 2
Figure 2
Original matrix of sociometric relations (left), and estimated relations obtained by the model (right).
Figure 3
Figure 3
Posterior mixed membership vectors, π1:18, projected in the simplex. The estimates correspond to a model with B:=I3, and α̂ = 0.058. Numbered points can be mapped to monks' names using the legend on the right. The colors identify the four factions defined by Sampson's anthropological observations.
Figure 4
Figure 4
Independent analyses of six graphs encoding the relations: positive and negative influence, positive and negative praise, esteem and disesteem. Posterior mixed membership vectors for each graph, corresponding to models with B:=I3, and α̂ via empirical Bayes, are projected in the simplex. (Legend as in Figure 3.)
Figure 5
Figure 5
Top: The two-layered variational inference for (γ,φpq,g,φpq,h) and M = 1. The inner algorithm consists of Step 5. The function f is described in details in the bottom panel. The partial updates in Step 6 for γ and B refer to Equation 18 of Section B.4 and Equation 19 of Section B.5, respectively. Bottom: Inference for the variational parameters (φpq,φpq) corresponding to the basic observation R(p, q). This nested algorithm details Step 5 in the top panel. The functions f1 and f2 are the updates for φp→q,g and φp←q,g described in Equations 16 and 17 of Section B.4.
Figure 6
Figure 6
Adjacency matrices of corresponding to simulated interaction graphs with 100 nodes and 4 clusters, 300 nodes and 10 clusters, 600 nodes and 20 clusters (top to bottom) and α equal to 0.05, 0.1 and 0.25 (left to right). Rows, which corresponds to nodes, are reordered according to their most likely membership. The estimated reordering reveals the original blockmodel in all the data settings we tested.
Figure 7
Figure 7
Left: The running time of the naïve variational inference (dashed, red line) against the running time of our enhanced (nested) variational inference algorithm (solid, black line), on a graph with 100 nodes and 4 clusters. Right: The held-out log-likelihood is indicative of the true number of latent clusters, on simulated data. In the example shown, the peak identifies the correct number of clusters, K* = 10.
Figure 8
Figure 8
Original matrix of friensdhip relations among 69 students in grades 7 to 12 (left), and friendship estimated relations obtained by thresholding the posterior expectations πpBπq|R (center), and φpBφq|R (right).
Figure 9
Figure 9
The posterior mixed membership scores, π, for the 69 students. Each panel correspond to a student; we order the clusters 1 to 6 on the X axis, and we measure the student's grade of membership to these clusters on the Y axis.
Figure 10
Figure 10
By mapping individual proteins to the 15 general functions in Table 2, we obtain a 15-dimensional representation for each protein. Here, each panel corresponds to a protein; the 15 functional categories are displayed on the X axis, whereas the presence or absence of the corresponding functional annotation is displayed on the Y axis. The plots at the bottom zoom into three example panels (proteins).
Figure 11
Figure 11
We estimate the mapping of latent groups to functions. The two plots show the marginal frequencies of membership of proteins to true functions (bottom) and to identified functions (top), in the cross-validation experiment. The mapping is selected to maximize the accuracy of the predictions on the training set, in the cross-validation experiment, and to minimize the divergence between marginal true and predicted frequencies if no training data is available—see Section 4.3.2.
Figure 12
Figure 12
Predicted mixed-membership probabilities (dashed, red lines) versus binary manually curated functional annotations (solid, black lines) for 6 example proteins. The identification of latent groups to functions is estimated, Figure 11.
Figure 13
Figure 13
In the top panel we measure the functional content of the the MIPS collection of protein interactions (yellow diamond), and compare it against other published collections of interactions and microarray data, and to the posterior estimates of the MMSB models—computed as described in Section 4.3.3. A breakdown of three estimated interaction networks (the points annotated 1, 2, and 3) into most represented gene ontology categories is detailed in Table 3.
Figure 14
Figure 14
We investigate the correlations between data collections (rows) and a sample of gene ontology categories (columns). The intensity of the square (red is high) measures the area under the precision-recall curve.

References

    1. Airoldi EM, Blei DM, Xing EP, Fienberg SE. ACM SIGKDD Workshop on Link Discovery: Issues, Approaches and Applications. 2005. A latent mixed-membership model for relational data.
    1. Airoldi EM, Fienberg SE, Joutard C, Love TM. Technical Report CMU-ML-06-101. School of Computer Science, Carnegie Mellon University; Apr, 2006a. Discovering latent patterns with hierarchical Bayesian mixed-membership models and the issue of model choice.
    1. Airoldi EM, Fienberg SE, Xing EP. Biological context analysis of gene expression data. Jun, 2006b. Manuscript.
    1. Alberts B, Johnson A, Lewis J, Raff M, Roberts K, Walter P. Molecular Biology of the Cell. 4th. Garland: 2002.
    1. Ashburner M, Ball CA, Blake JA, Botstein D, Butler H, Cherry JM, Davis AP, Dolinski K, Dwight SS, Eppig JT, Harris MA, Hill DP, Issel-Tarver L, Kasarskis A, Lewis S, Matese JC, Richardson JE, Ringwald M, Rubinand GM, Sherlock G. Gene ontology: Tool for the unification of biology. The gene ontology consortium. Nature Genetics. 2000;25(1):25–29. - PMC - PubMed

LinkOut - more resources