

doi: 10.1186/gb-2011-12-6-r60.
Metagenomic biomarker discovery and explanation
Affiliations
- PMID: 21702898
- PMCID: PMC3218848
- DOI: 10.1186/gb-2011-12-6-r60
Item in Clipboard
Metagenomic biomarker discovery and explanation
Genome Biol.
.
Abstract
This study describes and validates a new method for metagenomic biomarker discovery by way of class comparison, tests of biological consistency and effect size estimation. This addresses the challenge of finding organisms, genes, or pathways that consistently explain the differences between two or more microbial communities, which is a central problem to the study of metagenomics. We extensively validate our method on several microbiomes and a convenient online interface for the method is provided at http://huttenhower.sph.harvard.edu/lefse/.
Figures
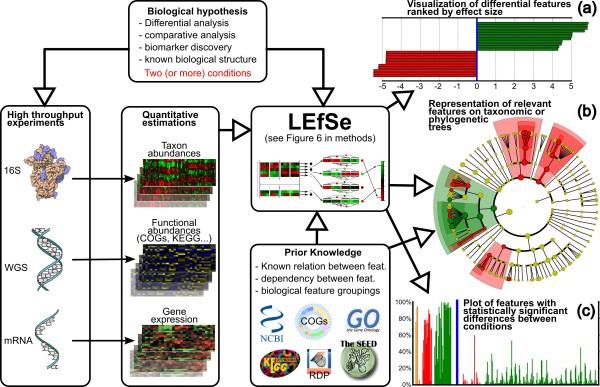
LEfSe mines a wide range of high-throughput genetic data to find biologically relevant features characterizing one or more experimental conditions. The inputs to the system are the specifications of the biological hypothesis under investigation (conditions and inter-condition sample groupings), the high-dimensional data obtained experimentally, and, optionally, prior knowledge from literature or databases used to define known relationships between features (used for meaningful hierarchical organization of the discovered biomarkers) or samples (used for testing biological consistency of potential biomarkers). LEfSe is a three-step algorithm (detailed in Figure 6). (a) LEfSe first provides the list of features that are differential among conditions of interest with statistical and biological significance, ranking them according to the effect size. (b) For problems with known hierarchical structure, either phylogenetic or functional, we then provide a mapping of the differences to taxonomic or functional trees. (c) Finally, the system produces a histogram visualizing the raw data within the specified problem structure for each relevant feature. While LEfSe has been developed primarily for metagenomic data containing taxon or gene abundances, it can be used for biomarker discovery in any setting where prior biological knowledge regarding the structure of a comparison is coupled with statistically significant differences in high-dimensional genomic features. KEGG, Kyoto Encyclopedia of Genes and Genomes; WGS, whole genome shotgun.
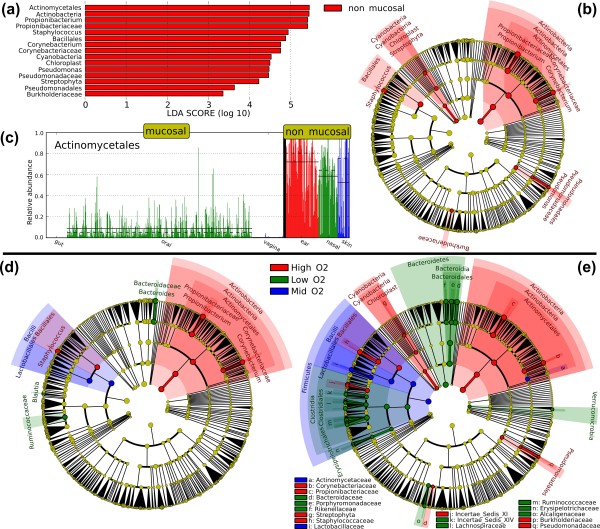
LEfSe results on human microbiomes. (a-c) Mucosal body site analysis. Mucosal microbial communities are diverse, while non-mucosal body sites are characterized by several clades, including the Actinobacteria. The analysis reported here is carried out on initial data from the Human Microbiome Project [55,56] assigning the main body sites to mucosal and non-mucosal classes, and using the body sites as subclasses. These graphical outputs were generated by the publicly available LEfSe visualization modules applied on the analysis results and integrating microbial taxonomic prior knowledge [58]. (a) Histogram of the LDA scores computed for features differentially abundant between mucosal and non-mucosal body sites. LEfSe scores can be interpreted as the degree of consistent difference in relative abundance between features in the two classes of analyzed microbial communities. The histogram thus identifies which clades among all those detected as statistically and biologically differential explain the greatest differences between communities. (b) Taxonomic representation of statistically and biologically consistent differences between mucosal and non-mucosal body sites. Differences are represented in the color of the most abundant class (red indicating non-mucosal, yellow non-significant). Each circle's diameter is proportional to the taxon's abundance. This representation, here employing the Ribosomal Database Project (RDP) taxonomy [58], simultaneously highlights high-level trends and specific genera - for example, multiple differentially abundant sibling taxa consistent with the variation of the parent clade. (c) Histogram of the Actinomycetales relative abundances (in the 0[1] interval) in mucosal and non-mucosal body sites. Subclasses (specific body sites) are differentially colored and the mean and median relative abundance of the Actinomycetales are indicated with solid and dashed lines, respectively. (d,e) Aerobiosis analysis. The cladograms report the taxa (highlighted by small circles and by shading) showing different abundance values (according to LEfSe) in the three O2-dependent classes as described in Results; for each taxon, the color denotes the class with higher median for both the small circles and the shading. (d) The strict (all classes differential) version of LEfSe detects 13 biomarkers whereas (e) the non-strict (at least one class differential) version of LEfSe detects 60 microbial biomarkers with abundance differential under aerobic, anaerobic, or microaerobic conditions. Additional file 2 reports the non-strict version of LEfSe focused on the Firmicutes phylum, highlighting several low-O2 specific genera within Ruminococcaceae and Lachnospiraceae.
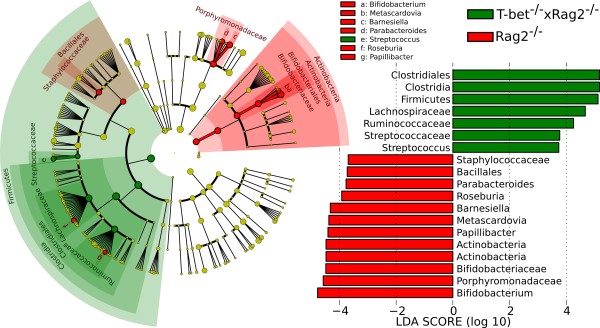
Comparison between Rag2-/- (control) and T-bet-/- × Rag2-/- (case) mice highlighting that, at the phylum level, Firmicutes are enriched in T-bet-/- × Rag2-/- mice, whereas Actinobacteria are enriched in Rag2-/- mice. In agreement with previous culture-based studies, Bifidobacterium species are underabundant in T-bet-/- × Rag2-/- mice [68], and LEfSe highlights several additional genus-level clades, including the specifically depleted Roseburia and Papillibacter within the otherwise overabundant Firmicutes.
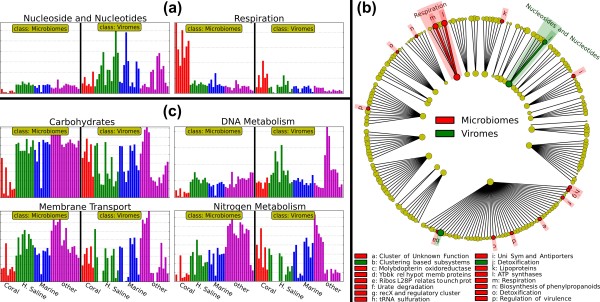
LEfSe highlights pathways consistently differential between bacterial microbiomes and viromes within diverse environmental subclasses. (a) Using the SEED [71] catalog of functional pathways, LEfSe reports Nucleoside and nucleotide metabolism and Respiration to differ consistently between bacterial microbiomes and viromes across environmental samples described in [70]. The former is significant using the strictest all-subclasses test, the latter in the more lenient one-subclass test. (b) A two-level cladogram reporting the significant pathway differences as visualized using the SEED hierarchy (see Additional file 3 for the three-level cladogram and detailed differences). (c) Metastats [45] reports four additional pathways differential among these data (Carbohydrates, DNA metabolism, Membrane transport and Nitrogen metabolism). Using only the KW test portion of LEfSe (α = 0.05), we obtain results consonant with Metastats (excluding Nitrogen metabolism). However, as shown here, an overview of the abundance histograms of these subsystems demonstrates them to be less consistent across environments (for example, Coral and Hyper-saline subclasses in the Carbohydrates, Membrane transport and Nitrogen metabolism) and to lose significance within individual subclasses (as for the DNA metabolism subsystem).
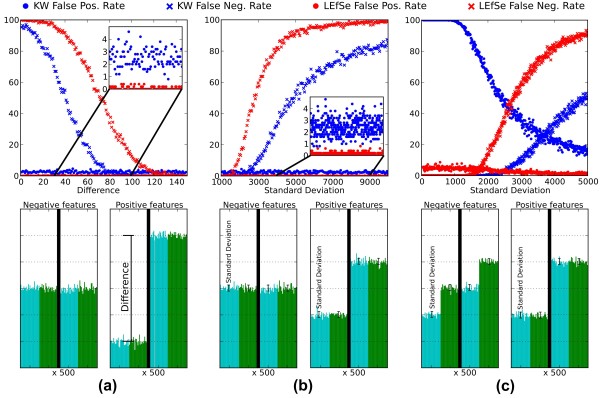
Comparison of LEfSe and the KW test alone for false positive and negative rates in synthetic data. Both tests used α = 0.05 in all cases, and the three artificial datasets comprise 100 samples, each in two classes, each with two subclasses of cardinality 25. The samples consist of 1,000 synthetic features taking the place of microbial taxa, pathways, and so on; half are negative (not biomarkers) and the other half positive. (a) LEfSe and KW false positive and negative rates at increasing values of the difference between class means. Negative features are normally distributed with parameters (μ = 10,000, σ = 100) across classes; positive features contain classes with increasingly different means. (b) Performance as standard deviation varies within classes (rather than the difference between means, fixed at 2,000). (c) Performance as standard deviation increases within inconsistent subclasses. Negative features have subclasses sampled from the same normal distribution (and thus not representing consistent biomarkers). Positive features are distributed as in (b). In all cases, LEfSe sacrifices a small number of false negatives in order to achieve a false positive rate near zero, with the goal of ensuring that biomarkers of large effect size will be both reproducible and biologically interpretable.
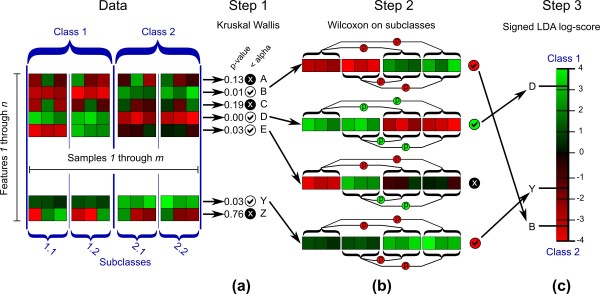
Schematic representation of the statistical and computational steps implemented in LEfSe. Input data consist of a collection of m samples (columns) each made up of n numerical features (rows, typically normalized per-sample, red representing high values and green low). These samples are labeled with a class (taking two or more possible values) that represents the main biological comparison under investigation; they may also have one or more subclass labels reflecting within-class groupings. (a) Step 1 analyzes all features, testing whether values in different classes are differentially distributed. (b) Features violating the null hypothesis are further analyzed in step 2, which tests whether all pairwise comparisons between subclasses in different classes significantly agree with the class level trend. (c) The resulting subset of vectors is used to build a LDA model from which the relative difference among classes is used to rank the features. The final output thus consists of a list of features that are discriminative with respect to the classes, consistent with the subclass grouping within classes, and ranked according to the effect size with which they differentiate classes.
References
-
- Tothill RW, Tinker AV, George J, Brown R, Fox SB, Lade S, Johnson DS, Trivett MK, Etemadmoghadam D, Locandro B, Traficante N, Fereday S, Hung JA, Chiew YE, Haviv I. Australian Ovarian Cancer Study Group; Gertig D, DeFazio A, Bowtell DD. Novel molecular subtypes of serous and endometrioid ovarian cancer linked to clinical outcome. Clin Cancer Res. 2008;14:5198–5208. doi: 10.1158/1078-0432.CCR-08-0196. - DOI - PubMed
-
- De Filippo C, Cavalieri D, Di Paola M, Ramazzotti M, Poullet JB, Massart S, Collini S, Pieraccini G, Lionetti P. Impact of diet in shaping gut microbiota revealed by a comparative study in children from Europe and rural Africa. Proc Natl Acad Sci USA. 2010;107:14691–14696. doi: 10.1073/pnas.1005963107. - DOI - PMC - PubMed
Publication types
MeSH terms
Substances
Grants and funding
LinkOut - more resources
Full Text Sources
Other Literature Sources
Medical
