Comparative Study
. 2011 Jun 24;43(1):24.
doi: 10.1186/1297-9686-43-24.

Comparative expression profiling of E. coli and S. aureus inoculated primary mammary gland cells sampled from cows with different genetic predispositions for somatic cell score

Affiliations
Comparative Study

Comparative expression profiling of E. coli and S. aureus inoculated primary mammary gland cells sampled from cows with different genetic predispositions for somatic cell score

Bodo Brand et al. Genet Sel Evol. .

Abstract

Background: During the past ten years many quantitative trait loci (QTL) affecting mastitis incidence and mastitis related traits like somatic cell score (SCS) were identified in cattle. However, little is known about the molecular architecture of QTL affecting mastitis susceptibility and the underlying physiological mechanisms and genes causing mastitis susceptibility. Here, a genome-wide expression analysis was conducted to analyze molecular mechanisms of mastitis susceptibility that are affected by a specific QTL for SCS on Bos taurus autosome 18 (BTA18). Thereby, some first insights were sought into the genetically determined mechanisms of mammary gland epithelial cells influencing the course of infection.

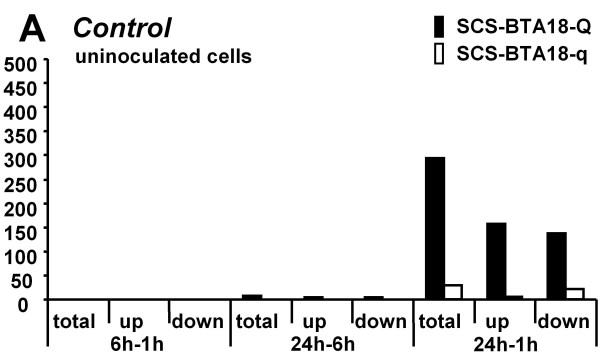
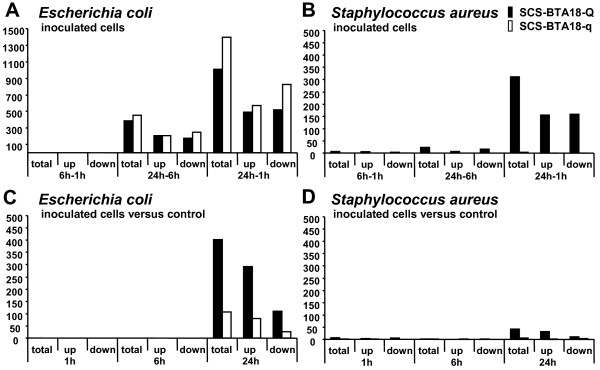
Methods: Primary bovine mammary gland epithelial cells (pbMEC) were sampled from the udder parenchyma of cows selected for high and low mastitis susceptibility by applying a marker-assisted selection strategy considering QTL and molecular marker information of a confirmed QTL for SCS in the telomeric region of BTA18. The cells were cultured and subsequently inoculated with heat-inactivated mastitis pathogens Escherichia coli and Staphylococcus aureus, respectively. After 1, 6 and 24 h, the cells were harvested and analyzed using the microarray expression chip technology to identify differences in mRNA expression profiles attributed to genetic predisposition, inoculation and cell culture.

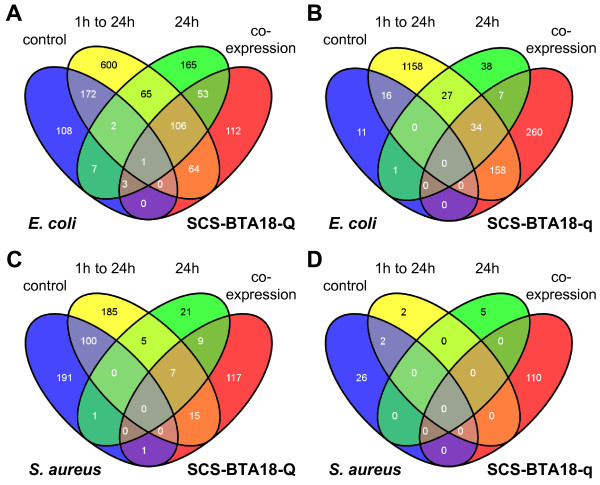
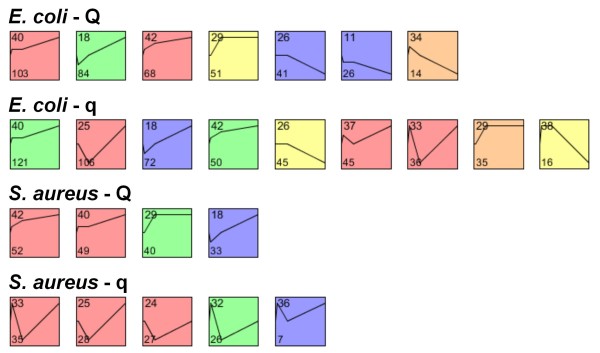
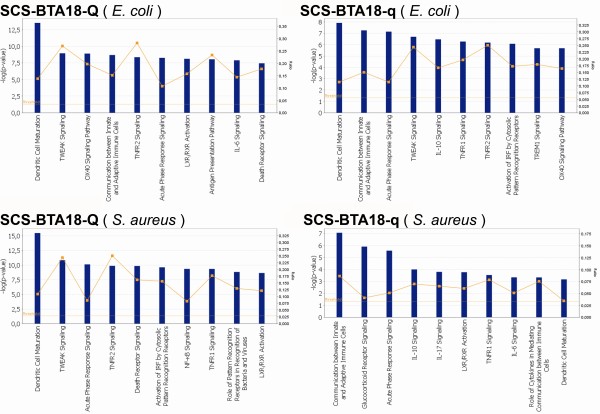
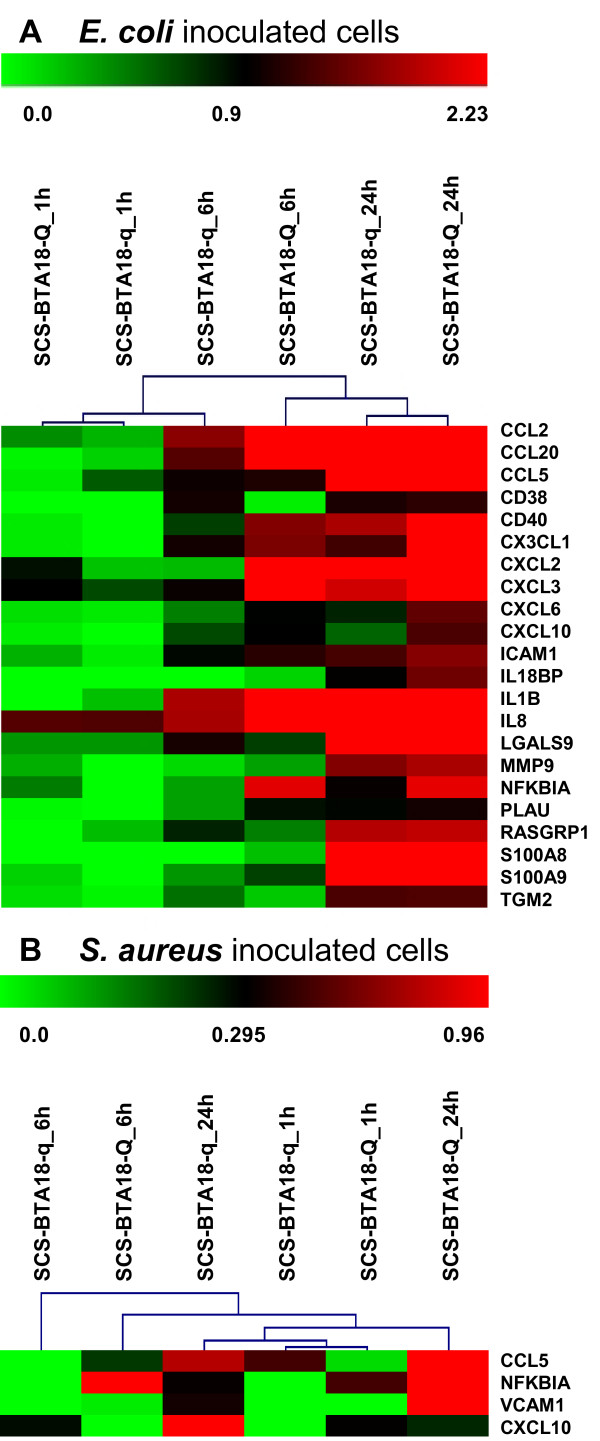
Results: Comparative analysis of co-expression profiles clearly showed a faster and stronger response after pathogen challenge in pbMEC from less susceptible animals that inherited the favorable QTL allele 'Q' than in pbMEC from more susceptible animals that inherited the unfavorable QTL allele 'q'. Furthermore, the results highlighted RELB as a functional and positional candidate gene and related non-canonical Nf-kappaB signaling as a functional mechanism affected by the QTL. However, in both groups, inoculation resulted in up-regulation of genes associated with the Ingenuity pathways 'dendritic cell maturation' and 'acute phase response signaling', whereas cell culture affected biological processes involved in 'cellular development'.

Conclusions: The results indicate that the complex expression profiling of pathogen challenged pbMEC sampled from cows inheriting alternative QTL alleles is suitable to study genetically determined molecular mechanisms of mastitis susceptibility in mammary epithelial cells in vitro and to highlight the most likely functional pathways and candidate genes underlying the QTL effect.


Figures

Figure 1
Figure 1
Differentially expressed genes between time points 1, 6 and 24 h of cell culture. Number of differentially genes (FDR adjusted p-value q ≤ 0.05) between time points 1, 6 and 24 h of cell culture for each of the inherited SCS-BTA18-QTL alleles, respectively.
Figure 2
Figure 2
Differentially expressed genes between and at time points 1, 6 and 24 h of bacterial challenge. Number of differentially expressed genes (FDR adjusted p-value q ≤ 0.05) between time points, for each pathogen challenge and each of the inherited SCS-BTA18-QTL alleles as well as between inoculated cells and control cells at time points for each pathogen challenge and each of the inherited SCS-BTA18-QTL alleles; A E. coli inoculated cells; B S. aureus inoculated cells; C E. coli inoculated cells versus control; D S. aureus inoculated cells versus control.
Figure 3
Figure 3
Four-Set Venn diagrams comparing differentially expressed genes between analyses. Comparison between significantly co-expressed genes at time point 24 h and significantly differentially expressed genes in control cells between time points 1 h and 24 h, in inoculated cells between time points 1 h and 24 h as well as between inoculated cells and control cells at time point 24 h for each pathogen and each QTL allele, respectively; A SCS-BTA18-Q cells inoculated with E. coli; B SCS-BTA18-q cells inoculated with E. coli; C SCS-BTA18-Q cells inoculated with S. aureus; D SCS-BTA18-q cells inoculated with S. aureus.
Figure 4
Figure 4
Significant co-expression profiles. Significantly enriched co-expression profiles clustered by the short time-series expression miner (STEM); profiles are ordered based on the p-value significance of the number of genes assigned to the co-expression profile versus the number of genes expected quantified by permutation; only significantly enriched profiles are shown; each square represents one probe level model; the line within the square represents the changes in the expression level during time-course between inoculated and control cells; in the upper left corner the number of the profile and in the lower left corner the number of assigned genes are shown; colors indicate similar profiles within each analysis.
Figure 5
Figure 5
Overview canonical pathways. Ingenuity canonical pathways affected during time-course between inoculated and control cells in SCS-BTA18-Q and SCS-BTA18-q cells inoculated with E. coli and S. aureus, respectively; blue bars indicate p-value significance and the orange threshold line indicates the p ≤ 0.05 significance thresholds; orange squares and lines indicate the ratio of genes found to be involved in the specific pathway to the overall number of genes involved in that pathway.
Figure 6
Figure 6
Hierarchical clustering of genes associated with leukocyte migration. Hierarchical clustering of expression data obtained for significantly co-expressed genes in SCS-BTA18-Q and SCS-BTA18-q cells associated with the Ingenuity functional category 'immune cell trafficking' that are involved in the migration of leucocytes; A E. coli inoculated cells; B S. aureus inoculated cells; heat map visualizes changes in gene expression levels between inoculated and control cells at time points; the log2 fold change ranges are shown at the upper bars.

Similar articles

Cited by

References

    1. Kossaibati MA, Esslemont RJ. The costs of production diseases in dairy herds in England. Vet J. 1997;154:41–51. - PubMed
    1. Seegers H, Fourichon C, Beaudeau F. Production effects related to mastitis and mastitis economics in dairy cattle herds. Vet Res. 2003;34:475–491. - PubMed
    1. Khatkar MS, Thomson PC, Tammen I, Raadsma HW. Quantitative trait loci mapping in dairy cattle: review and meta-analysis. Genet Sel Evol. 2004;36:163–190. - PMC - PubMed
    1. Ogorevc J, Kunej T, Razpet A, Dovc P. Database of cattle candidate genes and genetic markers for milk production and mastitis. Anim Genet. 2009;40:832–851. - PMC - PubMed
    1. Tao W, Mallard B. Differentially expressed genes associated with Staphylococcus aureus mastitis of Canadian Holstein cows. Vet Immunol Immunopathol. 2007;120:201–211. - PubMed

Publication types

MeSH terms