. 2011 Jun 24;13(3):R102.
doi: 10.1186/ar3383.

Novel multiplex technology for diagnostic characterization of rheumatoid arthritis

Affiliations

Novel multiplex technology for diagnostic characterization of rheumatoid arthritis

Piyanka E Chandra et al. Arthritis Res Ther. .

Abstract

Introduction: The aim of this study was to develop a clinical-grade, automated, multiplex system for the differential diagnosis and molecular stratification of rheumatoid arthritis (RA).

Methods: We profiled autoantibodies, cytokines, and bone-turnover products in sera from 120 patients with a diagnosis of RA of < 6 months' duration, as well as in sera from 27 patients with ankylosing spondylitis, 28 patients with psoriatic arthritis, and 25 healthy individuals. We used a commercial bead assay to measure cytokine levels and developed an array assay based on novel multiplex technology (Immunological Multi-Parameter Chip Technology) to evaluate autoantibody reactivities and bone-turnover markers. Data were analyzed by Significance Analysis of Microarrays and hierarchical clustering software.

Results: We developed a highly reproducible, automated, multiplex biomarker assay that can reliably distinguish between RA patients and healthy individuals or patients with other inflammatory arthritides. Identification of distinct biomarker signatures enabled molecular stratification of early-stage RA into clinically relevant subtypes. In this initial study, multiplex measurement of a subset of the differentiating biomarkers provided high sensitivity and specificity in the diagnostic discrimination of RA: Use of 3 biomarkers yielded a sensitivity of 84.2% and a specificity of 93.8%, and use of 4 biomarkers a sensitivity of 59.2% and a specificity of 96.3%.

Conclusions: The multiplex biomarker assay described herein has the potential to diagnose RA with greater sensitivity and specificity than do current clinical tests. Its ability to stratify RA patients in an automated and reproducible manner paves the way for the development of assays that can guide RA therapy.


Figures

Figure 1
Figure 1
Chips used for biomarker profiling on the IMPACT platform. (a) Images of an IMPACT synovial antigen chip 1 probed with sera derived from a patient with RA. Fluoresence was captured with a charge-coupled device camera and quantified by software analysis. The images are false color representations of the fluorescence signals detected. Blue represents low, green intermediate, yellow high, and white the highest levels of fluorescence. The upper chip image is enhanced in the lower image by conversion of the lowest 5% of signals to black and the top 5% of signals to white, with the color scale adjusted accordingly. The rheumatoid arthritis sample analyzed exhibits very high levels of autoantibody reactivity to fibrinogen A (616-635) (Cit 621, 627, 630), vimentin (58-77) (Cit 64, 69, 71), and profilaggrin (293-310) (Cit 301, 302)), and low levels of antibody reactivity to fibrinogen A (31-50) (Cit 35, 38, 42), biglycan (247-266), and histone 2B/e (1-20). (b) List of chips and their components.
Figure 2
Figure 2
Analytical precision of selected IMPACT assays and comparison with standard single assays. (a) Analytical precision. Intra-assay coefficients of variance (CV) were generated by performing 21 replicate measurements of each of nine markers in one sample within one run on the IMPACT platform. Inter-assay CVs were calculated based on results from 5 to 15 independent runs of the same sample on the IMPACT platform. The range of the CV for each marker corresponds to that of three independent pools of sample analyzed at low, medium, and high concentrations. (b) Correlation of values obtained with the Roche IMPACT platform with those obtained with the standard Roche Tina Quant (latex aggregation) assay. IgM autoantibody reactivity to rheumatoid factor (IgM-RF) in 1,312 RA serum samples was measured with the IMPACT platform and with Tina Quant assay. C-reactive protein (CRP) levels in 1,198 RA serum samples were measured with the IMPACT platform and with Tina Quant assay. Linear regression was used to determine the correlation between the multiplex chip assay (IMPACT) and the standard single assay (Tina Quant). IL-6, interleukin-6; MMP3, matrix metalloproteinase 3; SAA, serum amyloid A.
Figure 3
Figure 3
Proteomic characterization of serum samples from patients with rheumatoid arthritis, psoriatic arthritis, or ankylosing spondylitits. Autoantibody reactivities and levels of bone-turnover products in serum samples from 120 patients with rheumatoid arthritis (RA), 27 patients with ankylosing spondylitits (AS), 28 patients with psoriatic arthritis (PSA), and 25 healthy individuals were measured on the IMPACT platform. Cytokine levels were measured with a bead-based assay (Millipore) run on the Luminex platform. Values were normalized as described in the methods and subjected to hierarchical clustering; individual patients are listed above the heat map and the individual cytokines and antigens are listed to the right of the heat map. Cytokine levels and autoantibody reactivities are displayed, with blue representing a decrease relative to the mean value obtained in samples from healthy individuals, yellow no change, and red an increase. Cit, citrullinated; COMP, cartilage oligomeric matrix protein; CRP, C-reactive protein; FGF-2, fibroblast growth factor 2; GM-CSF, granulocyte macrophage colony-stimulating factor; HABP, hyaluronic acid binding protein; HSP 60, heat shock protein 60; IL, interleukin; MCP-1, monocyte chemoattractant protein 1; MMP3, matrix metalloproteinase 3; P1NP, procollagen type 1 amino-terminal propeptide; PTH, parathyroid hormone; RF, rheumatoid factor; TNFα, tumor necrosis factor α.
Figure 4
Figure 4
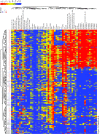
Increased markers of bone metabolism in ankylosing spondylitis. Autoantibody reactivity and bone-turnover products were characterized on the IMPACT platform in 27 ankylosing spondylitis (AS) patients and 25 healthy individuals. Cytokine levels in the same samples were measured using a bead-based assay run on the Luminex platform. Values were normalized as described in the methods. Significance Analysis of Microarrays (SAM) followed by a hierarchical clustering algorithm were used for determination of cluster relations that group patient samples (top dendrogram) and antigen reactivities (right dendrogram) based on similarities in patient autoantibodies and cytokines (false discovery rate < 1). Dendrogram branch lengths and distances between nodes illustrate the extent of similarities in antigen reactivity and cytokine levels, with blue representing a decrease relative to the mean value obtained in samples from healthy individuals, yellow no change, and red an increase. Bone-turnover markers are in red text. GM-CSF, granulocyte macrophage colony-stimulating factor; IL, interleukin; PTH, parathyroid hormone; TNFα, tumor necrosis factor α.
Figure 5
Figure 5
Autoantibodies and cytokine levels stratified according to anti-CCP seropositivity. Autoantibody and cytokine levels are higher in anti- cyclic citrullinated peptide (CCP)-antibody-positive than in anti-CCP-antibody-negative RA. Serum samples from 73 patients with anti-CCP-antibody-positive RA and from 47 patients with anti-CCP-antibody-negative RA were analyzed. Chips containing CCP were excluded from this analysis. Autoantibody reactivity was assessed on the IMPACT platform and cytokine levels were measured in a bead-based assay run on the Luminex platform. For assays run on the IMPACT platform, values were normalized as described in the methods. Significance Analysis of Microarrays (SAM) followed by a hierarchical clustering algorithm were used to determine cluster relations that group patient samples (top dendrogram) and antigen reactivities (right dendrogram) on the basis of similarities in patient autoantibody and cytokine profiles (false discovery rate < 1). Dendrogram branch lengths and distances between nodes illustrate the extent of similarities in antigen reactivity and cytokine levels, with blue representing a decrease relative to the mean value obtained in samples from healthy individuals, yellow no change, and red an increase. Cit, citrullinated; COMP, cartilage oligomeric matrix protein; FGF-2, fibroblast growth factor 2; GM-CSF, granulocyte macrophage colony-stimulating factor; IL, interleukin; RF, rheumatoid factor; TNFα, tumor necrosis factor α.
Figure 6
Figure 6
Autoantibodies and cytokine levels stratified according to RF seropositivity. Autoantibody and cytokine levels are higher in rheumatoid factor (RF)-positive RA than in RF-negative RA. Serum samples from 78 patients with RF-positive RA and from 42 patients with RF-negative RA were analyzed. Autoantibody reactivity was assessed on the IMPACT platform and cytokine levels were measured in a bead-based assay run on the Luminex platform. For assays run on the IMPACT platform, values were normalized as described in the methods. Significance Analysis of Microarrays (SAM) followed by a hierarchical clustering algorithm were used to determine cluster relations that group patient samples (top dendrogram) and antigen reactivities (right dendrogram) on the basis of similarities in patient autoantibody and cytokine profiles (false discovery rate < 1). Dendrogram branch lengths and distances between nodes illustrate the extent of similarities in antigen reactivity and cytokine levels, with blue representing a decrease relative to the mean value obtained in samples from healthy individuals, yellow no change, and red an increase. Cit, citrullinated; COMP, cartilage oligomeric matrix protein; FGF-2, fibroblast growth factor 2; GM-CSF, granulocyte macrophage colony-stimulating factor; IL, interleukin; RF, rheumatoid factor.
Figure 7
Figure 7
Autoantibodies and cytokine levels stratified according to presence of a shared epitope allele. Autoantibody levels are higher in RA patients with one or two shared-epitope alleles than in those with no shared-epitope alleles. Serum samples from 74 RA patients with either one or two copies of the shared epitope and from 46 RA patients with no shared epitope were characterized with the IMPACT platform. Autoantibody reactivity was assessed on the IMPACT platform and cytokine levels were measured in a bead-based assay run on the Luminex platform. For assays run on the IMPACT platform, values were normalized as described in the methods. Significance Analysis of Microarrays (SAM) followed by a hierarchical clustering algorithm were used to determine cluster relations that group patient samples (top dendrogram) and antigen reactivities (right dendrogram) on the basis of similarities in patient autoantibody and cytokine profiles (false discovery rate < 1). Dendrogram branch lengths and distances between nodes illustrate the extent of similarities in antigen reactivity and cytokine levels, with blue representing a decrease relative to the mean value obtained in samples from healthy individuals, yellow no change, and red an increase. Cit, citrullinated; RF, rheumatoid factor.

Comment in

References

    1. Hueber W, Kidd BA, Tomooka BH, Lee BJ, Bruce B, Fries JF, Sonderstrup G, Monach P, Drijfhout JW, van Venrooij WJ, Utz PJ, Genovese MC, Robinson WH. Antigen microarray profiling of autoantibodies in rheumatoid arthritis. Arthritis Rheum. 2005;52:2645–2655. doi: 10.1002/art.21269. - DOI - PubMed
    1. Hueber W, Tomooka BH, Zhao X, Kidd BA, Drijfhout JW, Fries JF, van Venrooij WJ, Metzger AL, Genovese MC, Robinson WH. Proteomic analysis of secreted proteins in early rheumatoid arthritis: anti-citrulline autoreactivity is associated with up regulation of proinflammatory cytokines. Ann Rheum Dis. 2007;66:712–719. doi: 10.1136/ard.2006.054924. - DOI - PMC - PubMed
    1. Kievit W, Fransen J, Oerlemans AJ, Kuper HH, van der Laar MA, de Rooij DJ, De Gendt CM, Ronday KH, Jansen TL, van Oijen PC, Brus HL, Adang EM, van Riel PL. The efficacy of anti-TNF in rheumatoid arthritis, a comparison between randomised controlled trials and clinical practice. Ann Rheum Dis. 2007;66:1473–1478. doi: 10.1136/ard.2007.072447. - DOI - PMC - PubMed
    1. Hueber W, Tomooka BH, Batliwalla F, Li W, Monach PA, Tibshirani RJ, Van Vollenhoven RF, Lampa J, Saito K, Tanaka Y, Genovese MC, Klareskog L, Gregersen PK, Robinson WH. Blood autoantibody and cytokine profiles predict response to anti-tumor necrosis factor therapy in rheumatoid arthritis. Arthritis Res Ther. 2009;11:R76. doi: 10.1186/ar2706. - DOI - PMC - PubMed
    1. Claudon A, Vergnaud P, Valverde C, Mayr A, Klause U, Garnero P. New automated multiplex assay for bone turnover markers in osteoporosis. Clin Chem. 2008;54:1554–1563. doi: 10.1373/clinchem.2008.105866. - DOI - PubMed

Publication types

MeSH terms