

Stratified sampling design and loss to follow-up in survival models: evaluation of efficiency and bias
- PMID: 21703013
- PMCID: PMC3144452
- DOI: 10.1186/1471-2288-11-99
Stratified sampling design and loss to follow-up in survival models: evaluation of efficiency and bias
Abstract
Background: Longitudinal studies often employ complex sample designs to optimize sample size, over-representing population groups of interest. The effect of sample design on parameter estimates is quite often ignored, particularly when fitting survival models. Another major problem in long-term cohort studies is the potential bias due to loss to follow-up.
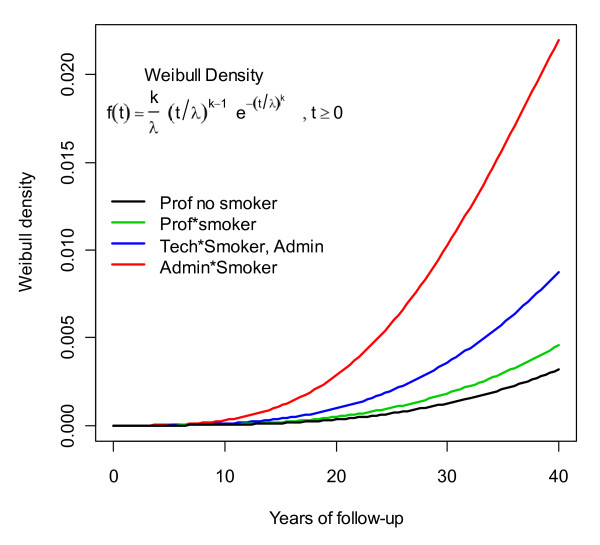
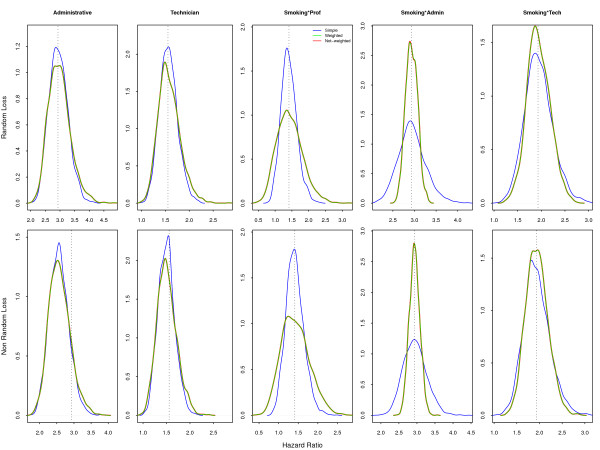
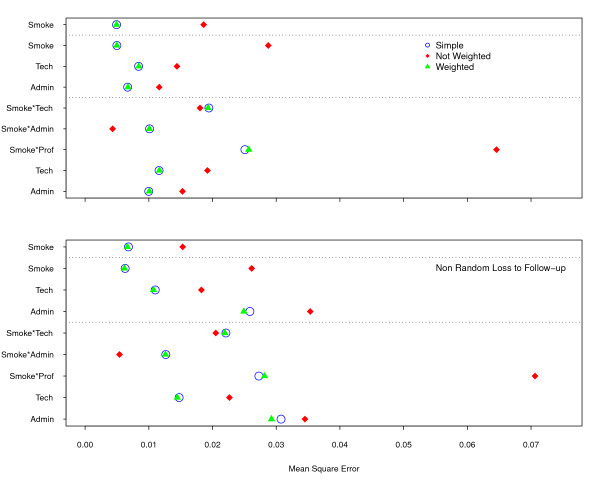
Methods: In this paper we simulated a dataset with approximately 50,000 individuals as the target population and 15,000 participants to be followed up for 40 years, both based on real cohort studies of cardiovascular diseases. Two sample strategies--simple random (our golden standard) and Stratified by professional group, with non-proportional allocation--and two loss to follow-up scenarios--non-informative censoring and losses related to the professional group--were analyzed.
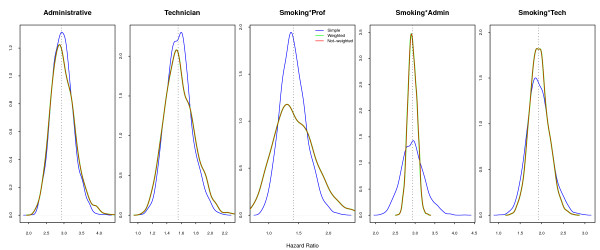
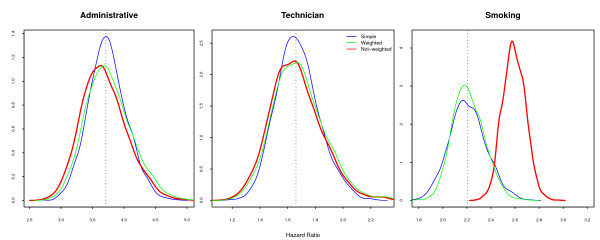
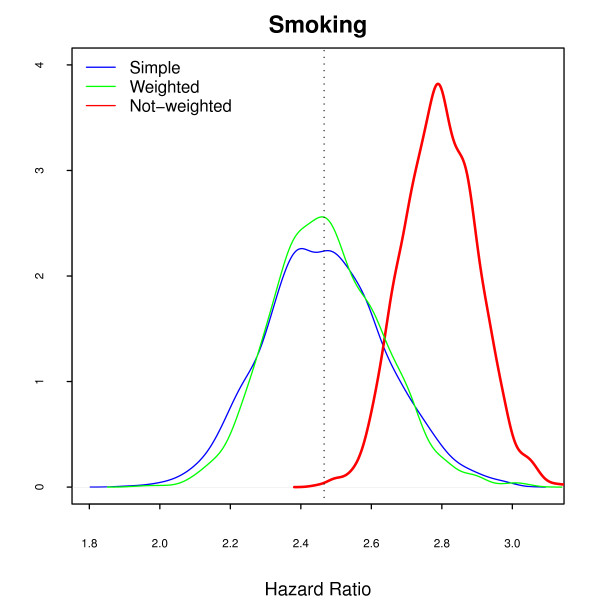
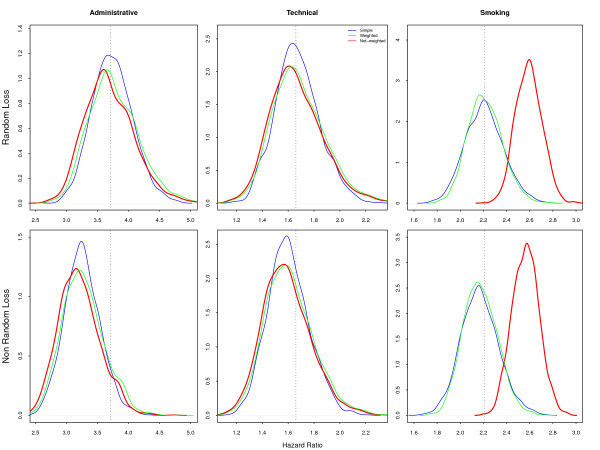
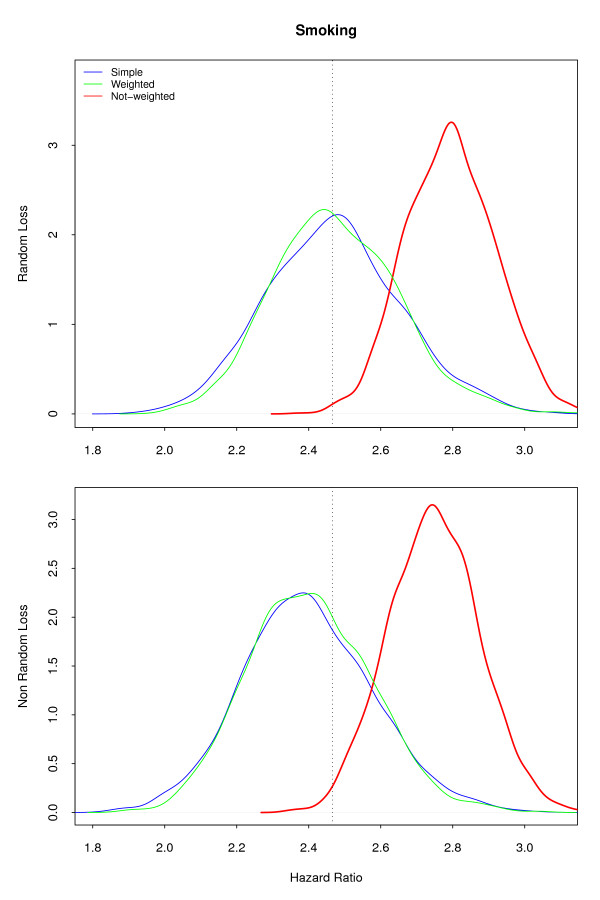
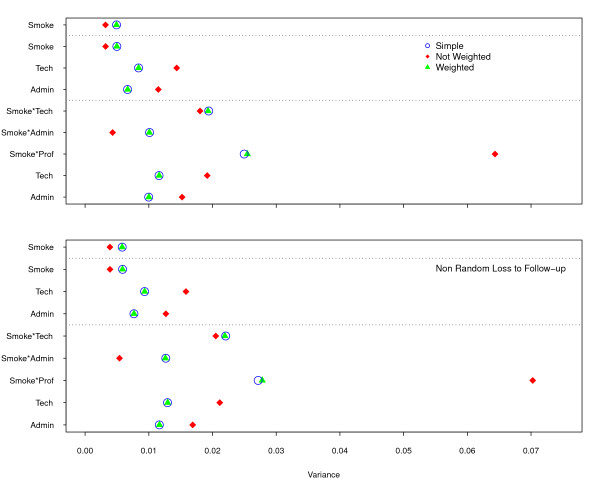
Results: Two modeling approaches were evaluated: weighted and non-weighted fit. Our results indicate that under the correctly specified model, ignoring the sample weights does not affect the results. However, the model ignoring the interaction of sample strata with the variable of interest and the crude estimates were highly biased.
Conclusions: In epidemiological studies misspecification should always be considered, as different sources of variability, related to the individuals and not captured by the covariates, are always present. Therefore, allowance must be made for the possibility of unknown confounders and interactions with the main variable of interest in our data. It is strongly recommended always to correct by sample weights.
Figures
Similar articles
-
Correcting for dependent censoring in routine outcome monitoring data by applying the inverse probability censoring weighted estimator.Stat Methods Med Res. 2018 Feb;27(2):323-335. doi: 10.1177/0962280216628900. Epub 2016 Mar 17. Stat Methods Med Res. 2018. PMID: 26988930
-
Calibration adjustments to address bias in mortality analyses due to informative sampling-a census-linked survey analysis in Switzerland.PeerJ. 2018 Feb 13;6:e4376. doi: 10.7717/peerj.4376. eCollection 2018. PeerJ. 2018. PMID: 29456895 Free PMC article.
-
Mortality and Morbidity Effects of Long-Term Exposure to Low-Level PM2.5, BC, NO2, and O3: An Analysis of European Cohorts in the ELAPSE Project.Res Rep Health Eff Inst. 2021 Sep;2021(208):1-127. Res Rep Health Eff Inst. 2021. PMID: 36106702 Free PMC article.
-
Impact of summer programmes on the outcomes of disadvantaged or 'at risk' young people: A systematic review.Campbell Syst Rev. 2024 Jun 13;20(2):e1406. doi: 10.1002/cl2.1406. eCollection 2024 Jun. Campbell Syst Rev. 2024. PMID: 38873396 Free PMC article. Review.
-
Life expectancy biases in clinical decision modeling.Med Decis Making. 1995 Apr-Jun;15(2):158-69. doi: 10.1177/0272989X9501500209. Med Decis Making. 1995. PMID: 7783577 Review.
Cited by
-
Simplifying Data Analysis in Biomedical Research: An Automated, User-Friendly Tool.Methods Protoc. 2024 Apr 24;7(3):36. doi: 10.3390/mps7030036. Methods Protoc. 2024. PMID: 38804330 Free PMC article.
References
-
- Kalsbeek W, Heiss G. Building bridges between populations and samples in epidemiological studies. Annu Rev Public Health. 2000;21:147–169. doi: 10.1146/annurev.publhealth.21.1.147. http://dx.doi.org/10.1146/annurev.publhealth.21.1.147 - DOI - DOI - PubMed
-
- Xie Y. Otis Dudley Duncan's legacy: The demographic approach to quantitative reasoning in social science. Research in Social Stratification and Mobility. 2007;25:141–156. doi: 10.1016/j.rssm.2007.05.006. - DOI
-
- DuMouchel W, Duncan G. Using sample survey weights in multiple regression analysis of stratified samples. Journal of the American Statistical Association. 1983;78:535–548. doi: 10.2307/2288115. - DOI
-
- Kish L. Survey Sampling. John Wiley; 1965.
-
- Lawless J. Censoring and weighting in survival estimation from survey data. Proceedings of the Survey Mehods Section, Statistical Society of Canada 2003 Annual Meeting, Statistical Society of Canada. 2003.
Publication types
MeSH terms
LinkOut - more resources
Full Text Sources
