. 2011 Dec;55(6):1281-90.
doi: 10.1016/j.jhep.2011.03.017. Epub 2011 Apr 14.

Cytosolic phospholipase A(2)α protects against Fas- but not LPS-induced liver injury

Affiliations

Cytosolic phospholipase A(2)α protects against Fas- but not LPS-induced liver injury

Guiying Li et al. J Hepatol. 2011 Dec.

Abstract

Background & aims: Cytosolic phospholipase A(2)α (cPLA(2)α) is a rate-limiting key enzyme controlling the release of arachidonic acid (AA) substrate for the synthesis of prostaglandins and leukotrienes. This study was designed to explore the role of hepatocyte cPLA(2)α in Fas-mediated liver injury, in vivo.

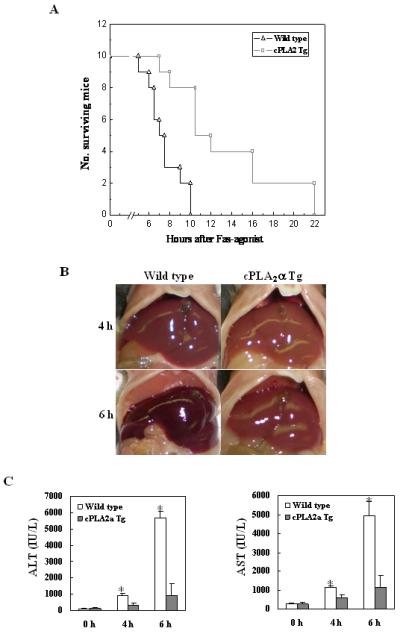
Methods: Transgenic mice with targeted expression of cPLA(2)α under control of the albumin-promoter enhancer and wild-type mice were injected intraperitoneally with anti-Fas antibody Jo2 or lipopolysaccharide plus d-galactosamine and monitored for liver injury and survival at various time points.

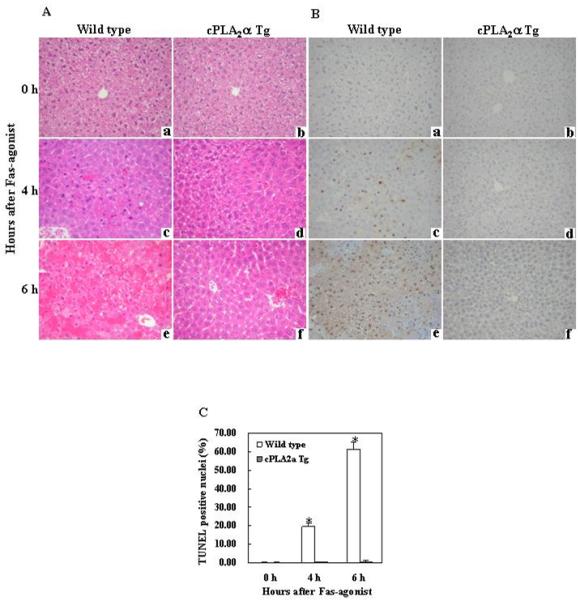
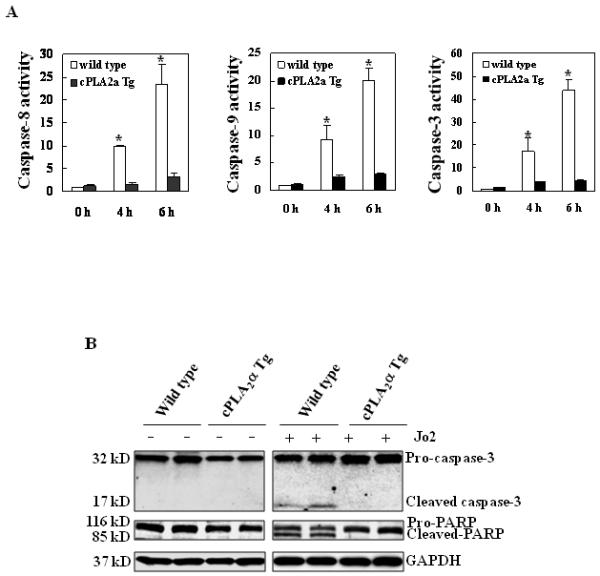
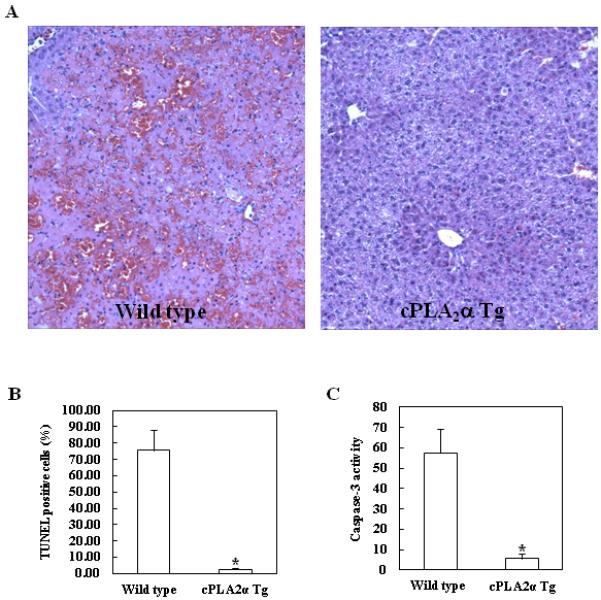
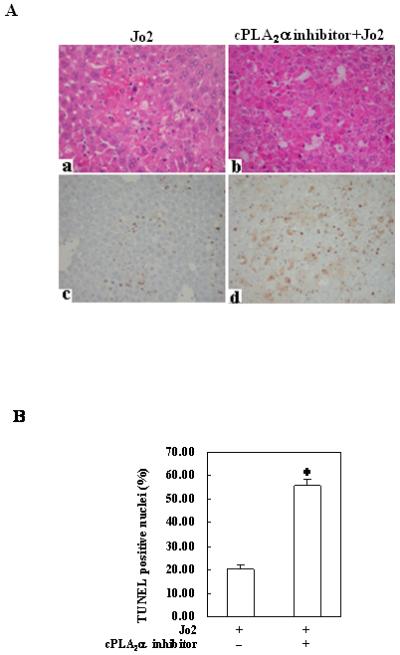
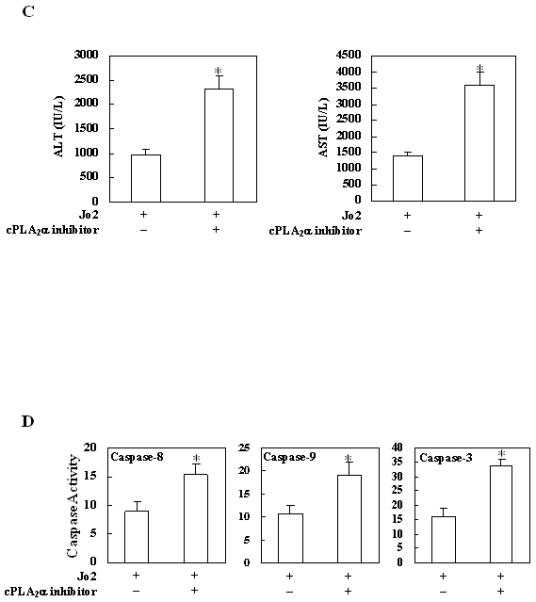
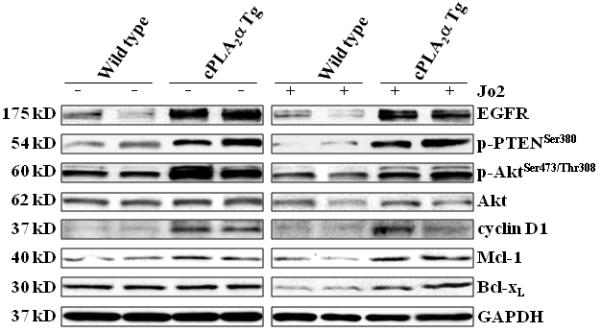
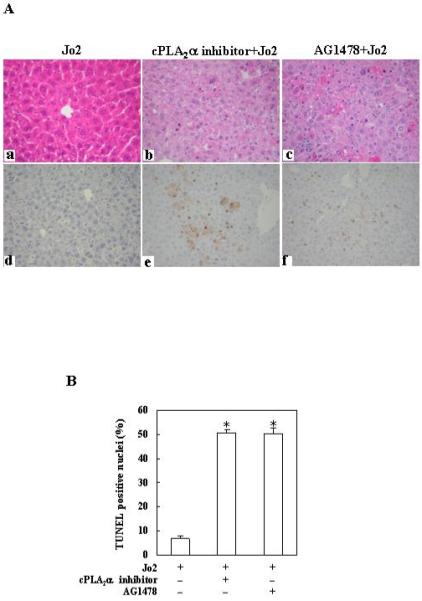
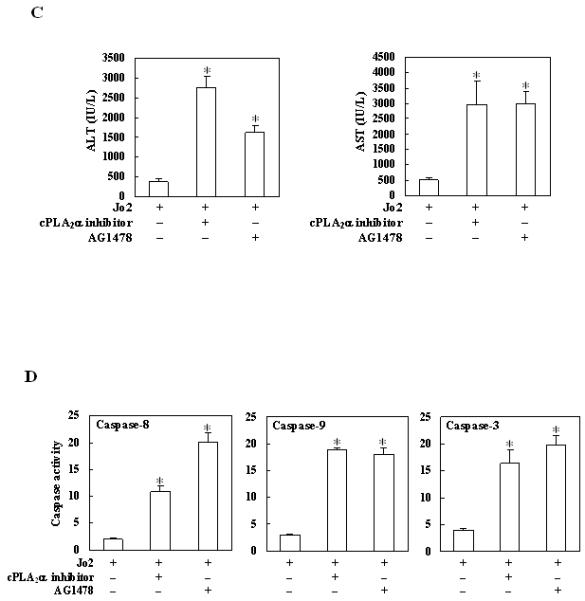
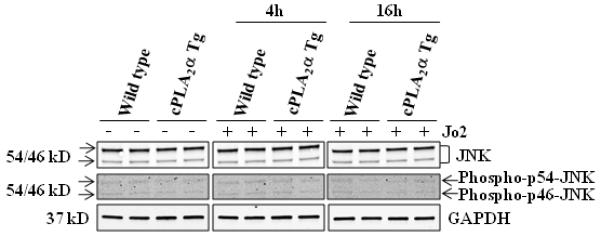
Results: The cPLA(2)α Tg mice resist Fas-induced liver failure, as reflected by the lower serum transaminase levels, fewer apoptotic hepatocytes, reduced caspase activation, and reduced PARP cleavage when compared to the matched wild type mice. Inhibition of cPLA(2)α by its pharmacological inhibitor, pyrrolidine, enhanced Jo2-induced liver injury in both cPLA(2)α Tg and wild type mice. Hepatic overexpression of cPLA(2)α increases the expression of EGFR in the liver and the EGFR inhibitor, AG1478, exacerbated Jo2-mediated liver injury. The cPLA(2)α transgenic mice develop more prominent liver tissue damage than wild-type mice after LPS/d-galactosamine injection.

Conclusions: Hepatocyte cPLA(2)α protects against Fas-induced liver injury and this effect is mediated at least in part through the upregulation of EGFR.


Figures

Figure 1
Figure 1. Hepatic overexpression of cPLA2α prevents Fas-induced liver injury
The cPLA2α Tg mice and their age/sex-matched wild type mice were injected intraperitoneally with a single dose of purified hamster anti-mouse Fas monoclonal antibody Jo2 (0.5 μg/g body weight) to induce hepatocyte apoptosis. (A) Survival curve of wild type and cPLA2α Tg mice after Jo2 injection. The cPLA2α Tg (n=10) and wild type mice (n=10) at 8-10 weeks of age received an intraperitoneal injection of Jo2 and the animals were closely monitored for activity and survival. (B) Gross photographs of liver taken 4 hours and 6 hours after Jo2 injection. The livers of wild type mice turned to dark red after Jo2 injection because of massive hepatic hemorrhage, which was observed at 4 hour and became much more prominent at 6 h. In contrast, the livers of cPLA2α Tg mice were completely normal at 4 h and became slightly red at 6 h. (C) Serum levels of ALT and AST at 4 h and 6 h after Jo2 injection. Blood samples were collected and sera were separated for transaminase analysis. The cPLA2α Tg mice show significantly lower serum ALT and AST levels than the wild type mice after Jo2 treatment. The data are expressed as mean ±SD from 6 mice (*p<0.01 vs. corresponding cPLA2α Tg mice, Student’s t test).
Figure 2
Figure 2. Hepatic overexpression of cPLA2α suppresses Fas-induced hepatocyte apoptosis and liver tissue damage
The cPLA2α Tg mice and their age/sex-matched wild type mice were administered intraperitoneally with saline or Jo2 ( 0.5 μg/g body weight ). The animals were sacrificed at 0 (a and b), 4 (c and d) and 6 (e and f) hours after injection and the liver tissues were harvested for histological evaluation. Formalin-fixed and paraffin-embedded sections (5 μm thick) were stained with hematoxylin and eosin (H&E) (A), and terminal deoxynucleotidy1 – transferase-mediated deoxyuridine triphosphate-digoxigenin nick-end labeling (TUNEL) (B) (200 × ). After Jo2 administration, the livers of the wild type mice exhibit more prominent hemorrhagic necrosis, hepatocyte apoptosis and degeneration (c and e), when compared to the livers of cPLA2α Tg mice (d and f). The number of TUNEL-positive hepatocytes in the wild type mice is significantly higher than in the cPLA2α Tg mice (*p<0.01 compared to the corresponding cPLA2α Tg mice, the data are expressed as mean ±SD from 6 mice) (C).
Figure 3
Figure 3. Hepatic overexpression of cPLA2α protects the liver from Fas-induced apoptosis
The cPLA2α Tg and their matched wild type mice were administered intraperitoneally with saline or Jo2 (0.5 μg/g body weight). The animals were sacrificed 4 hours after the injection and the liver tissues were harvested and homogenized. (A) The levels of caspases-3, 8, and 9 activities in liver homogenates. Caspase-3, 9, and 8 activities were measured by fluorometric assay with Ac-DEVD-AFC, Ac-LEHD-AFC, and Ac-IETD-AFC as the substrates, respectively. The wild type mice showed higher caspase activities than cPLA2α Tg mice after Jo2 treatment. The results are expressed as mean ±SD of fold changes over wild type livers (*p<0.01 compared to the corresponding cPLA2α Tg mice, n = 6 for each group). (B) Western blot analysis to detect caspase-3 and PARP cleavage. Liver homogenates from the cPLA2α Tg and wild type livers were subjected to SDS-PAGE and Western blot analysis to determine the protein level of proform and cleaved caspase-3 and PARP. Western blot for GAPDH was used as the loading control. Jo2 treatment for 4 hours induced capase-3 and PARP cleavage in the wild type mice, but not in the cPLA2α Tg mice.
Figure 4
Figure 4. Hepatic overexpression of cPLA2α protects the liver from Fas-induced apoptosis (16 hours after Jo2 injection)
The cPLA2α Tg mice and their age/sex-matched wild type mice were intraperitoneally administered with 0.25 μg/g body weight of Jo2 and the animals were sacrificed 16h after Jo2 injection. The liver tissues were harvested for histological evaluation and caspase activity assay. (A) Formalin-fixed and paraffin-embedded sections (5 μm thick) were stained with H&E (Magnification x 100). The wild type mice showed more prominent hepatocyte apoptosis and liver injury when compared to the cPLA2α Tg mice. (B) The number of TUNEL-positive hepatocytes in the wild type mice was significantly higher than that in the cPLA2α Tg mice. The data are expressed as means ±standard deviation from six mice per group (*p<0.01). (C) The activity of caspase 3 in the wild type mice was significantly increased compared with the cPLA2α Tg mice (*p<0.01).
Figure 5
Figure 5. Effects of the cPLA2 inhibitor on Fas-induced hepatocyte apoptosis and liver injury in wild type mice
The animals were injected intraperitoneally with the cPLA2α inhibitor pyrrolidine (3 mg/kg body weight) 30 minutes before intraperitoneal administration of Jo2 (0.5 mg/kg body weight). The animals were sacrificed 4 hours after Jo2 injection and the liver tissues were harvested. (A) Representative H&E and TUNEL stains (200×) of the liver tissues from mice pretreated with or without inhibitors (all the mice received Jo2 injection). (B) Quantitation of TUNEL-positive hepatocytes in mice pretreated with or without inhibitors (*p < 0.01 compared to the corresponding wild type mice without inhibitor pretreatment, n = 6 for each group). (C) Serum transaminases. Blood samples were collected at the time of sacrifice and sera were separated for transaminase analysis. Pretreatment of wild type mice with cPLA2 inhibitor induced significantly higher serum ALT and AST levels when compared to pretreatment with vehicle control. The data are expressed as mean ±SD from 6 mice (*p<0.01 vs. corresponding mice pretreated with vehicle, Student’s t test). (D) Caspase activities. The harvested liver tissues were homogenized for subsequent caspase activity assay. Caspase-3, 9, and 8 activities were measured by fluorometric assay with Ac-DEVD-AFC, Ac-LEHD-AFC, and Ac-IETD-AFC as substrate, respectively. Pretreatment with cPLA2 inhibitor induced significantly higher caspase activities than the vehicle control. The results are expressed as mean ±SD of fold changes over wild type livers (*p<0.01 compared to the corresponding mice pretreated with vehicle, n = 6 for each group).
Figure 6
Figure 6. Changes of anti-apoptosis related signaling molecules in livers with altered expression of cPLA2α
The cPLA2α Tg and wild type mice were injected intraperitoneally with saline or Jo2 (0.5 μg/g body weight). The livers were harvested 4 hours after the injection and the liver tissues were then homogenized. The obtained cellular proteins were subjected to SDS-PAGE and Western blot analysis to determine the protein levels of EGFR, phospho-PTEN, phospho-Akt, Akt, cyclin D1, Mcl-1 and Bcl-xL. Western blot for GAPDH was shown as the loading control.
Figure 7
Figure 7. The expression of EGFR is increased in the cPLA2α transgenic mice. The effect of the cPLA2α inhibitor (pyrrolidine)
The cPLA2α Tg and wild type mice were treated intraperitoneally with vehicle (DMSO) or pyrrolidine (3 mg/kg) and animals were sacrificed at 4 hours after injection. The liver tissues were then homogenized to extract mRNA for real time quantitative PCR (qPCR) and protein for Western blotting analysis. (A) Real time quantitative PCR (qPCR) showed increased EGFR mRNA level in the cPLA2α Tg mice compared to the wild type mice. Treatment with the cPLA2α inhibitor, pyrrolidine, significantly reduced EGFR mRNA level. The data are presented as Mean + SD (n = 3, *p<0.01). (B) Western blot analysis showed reduced level of EGFR protein in mice treated with pyrrolidine.
Figure 8
Figure 8. Effect of the cPLA2α inhibitor or EGFR inhibitor on Fas-induced liver injury in cPLA2α Tg mice
The mice were injected intraperitoneally with the cPLA2α inhibitor pyrrolidine (3 mg/kg body weight) or the EGFR inhibitor AG1478 (25 mg/kg body weight) 30 minutes before intraperitoneal administration of Jo2 (0.5 mg/kg body weight). The animals were sacrificed 4 hours after Jo2 injection and the liver tissues were harvested. (A) Representative H&E (a-c) and TUNEL stains (d-f) (200×) of the liver tissues from mice pretreated with or without inhibitors (all the mice received Jo2 injection). (B) Quantitation of TUNEL-positive hepatocytes in mice pretreated with or without inhibitors (*p < 0.01 compared to the corresponding cPLA2α Tg mice without inhibitor pretreatment, n = 6). (C) Serum transaminases. Upon sacrifice the blood samples were collected for serum transaminase analysis. Pretreatment with inhibitors induced significantly higher serum ALT and AST levels when compared to pretreatment with vehicle control. *p<0.01 compared to the corresponding cPLA2α Tg mice without inhibitor pretreatment (n = 6). (D) Caspase activities. The liver tissue homogenates were analyzed for caspase-3, 9, and 8 activities by fluorometric assay with Ac-DEVD-AFC, Ac-LEHD-AFC, and Ac-IETD-AFC as substrate, respectively. The data are expressed as mean ±SD of changes over wild type livers (n = 6 for each group). *p<0.01 compared to the corresponding cPLA2α Tg mice without inhibitor pretreatment.
Figure 9
Figure 9. The level of JNK and phospho-p54/46-JNK in cPLA2α Tg mice and wild type mice
The cPLA2α Tg and wild type mice were intraperitoneally administered with 0.5 μg/g or 0.25 μg/g body weight of Jo2 and sacrificed at 4h or 16h, respectively. The liver tissue proteins were subjected to SDS-PAGE and western blot analysis to determine the protein level of JNK and phospho-p54/46-JNK. GAPDH is used as the loading control.

Similar articles

Cited by

References

    1. Adachi T, Nakashima S, Saji S, Nakamura T, Nozawa Y. Roles of prostaglandin production and mitogen-activated protein kinase activation in hepatocyte growth factor-mediated rat hepatocyte proliferation. Hepatology. 1995;21(6):1668–1674. - PubMed
    1. Andreis PG, Whitfield JF, Armato U. Stimulation of DNA synthesis and mitosis of hepatocytes in primary cultures of neonatal rat liver by arachidonic acid and prostaglandins. Exp Cell Res. 1981 Aug;134(2):265–272. - PubMed
    1. Atsumi G, Tajima M, Hadano A, Nakatani Y, Murakami M, Kudo I. Fas-induced arachidonic acid release is mediated by Ca2+-independent phospholipase A2 but not cytosolic phospholipase A2, which undergoes proteolytic inactivation. J Biol Chem. 1998;273(22):13870–13877. - PubMed
    1. Bell A, Chen Q, DeFrances MC, Michalopoulos GK, Zarnegar R. The five amino acid-deleted isoform of hepatocyte growth factor promotes carcinogenesis in transgenic mice. Oncogene. 1999;18(4):887–895. - PubMed
    1. Burke JE, Dennis EA. Phospholipase A2 structure/function, mechanism, and signaling. J Lipid Res. 2009 Apr;50(Suppl):S237–242. - PMC - PubMed

Publication types

MeSH terms