

doi: 10.1053/j.gastro.2011.06.020.
Epub 2011 Jun 22.
Angle-resolved low coherence interferometry for detection of dysplasia in Barrett's esophagus
Affiliations
- PMID: 21703265
- PMCID: PMC3152604
- DOI: 10.1053/j.gastro.2011.06.020
Item in Clipboard
Angle-resolved low coherence interferometry for detection of dysplasia in Barrett's esophagus
Gastroenterology.
2011 Aug.
No abstract available
Figures

A) Simplified a/LCI system diagram. Red arrows indicate direction of light: delivery of light using polarization maintaining (PM) fiber, collection of angular scattering using a fiber bundle and the reference arm using single mode (SM) fiber. B) Images of a/LCI probe tip next to a US dime for scale (left) and the mark left by the probe (right, arrow). C) a/LCI in vivo clinical trial results. Points are colored according to their pathological diagnosis and plotted as a function of their nuclear size and density as measured by a/LCI. Dashed line indicates an optimal decision line identifying dysplastic tissue sites with a sensitivity of 100% (13/13) and a specificity of 84% (134/159). Adapted from Reference .
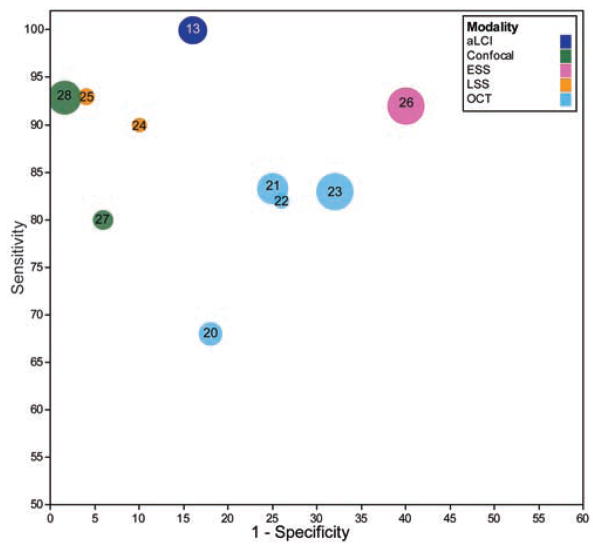
Sensitivity and specificity relationship between in vivo BE dysplasia studies, plotted on an ROC curve. Numbers indicated correspond to bibliographic reference number. This plot shows the ability of the studies to differentiate LGD+HGD+Cancer from healthy tissue when data are available. In the case of only HGD+ differentiation being performed, that figure is used instead. Circle size indicates the number of patients in the study.
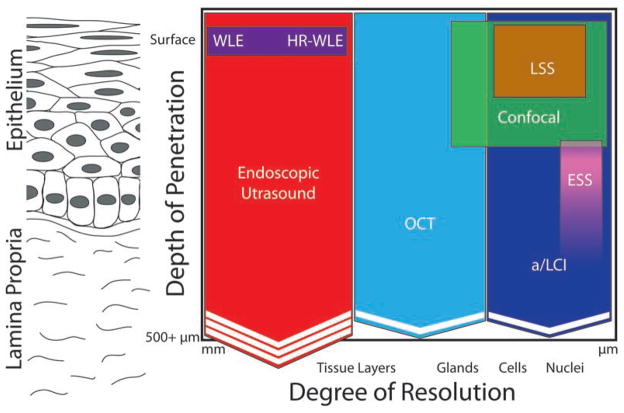
Qualitative comparison of resolution/depth penetration for various endoscopic advanced imaging modalities. The Y axis of the figure denotes the depth to which the imaging modality can probe the tissue. The X axis denotes the degree of resolution, with modalities on the right side of the figure providing a higher degree of resolution than those on the left. Chevrons indicate the ability of a modality to penetrate deeper than indicated and increased numbers of chevrons indicates increased penetration ability.
References
-
- Shaheen N, Ransohoff DF. Gastroesophageal reflux, barrett esophagus, and esophageal cancer: scientific review. JAMA. 2002;287:1972–1981. - PubMed
-
- Pohl H, Welch HG. The Role of Overdiagnosis and Reclassification in the Marked Increase of Esophageal Adenocarcinoma Incidence. JNCI. 2005;97:142–146. - PubMed
-
- Eloubeidi MA, Mason AC, Desmond RA, et al. Temporal trends (1973–1997) in survival of patients with esophageal adenocarcinoma in the United States: a glimmer of hope. Am J Gastroenterol. 2003;98:1627–1633. - PubMed
-
- Wang KK, Sampliner RE. Updated Guidelines 2008 for the Diagnosis, Surveillance and Therapy of Barrett's Esophagus. Am J Gastroenterol. 2008;103:788–797. - PubMed
-
- Inadomi JM, Sampliner R, Lagergren J, et al. Screening and surveillance for Barrett esophagus in high-risk groups: a cost-utility analysis. Ann Inter Med. 2003;138:176–186. - PubMed
Publication types
MeSH terms
Grants and funding
LinkOut - more resources
Full Text Sources
Other Literature Sources
