. 2011 Jul;179(1):315-34.
doi: 10.1016/j.ajpath.2011.03.021. Epub 2011 May 10.

Time-course and regional analyses of the physiopathological changes induced after cerebral injection of an amyloid β fragment in rats

Affiliations

Time-course and regional analyses of the physiopathological changes induced after cerebral injection of an amyloid β fragment in rats

Charleine Zussy et al. Am J Pathol. 2011 Jul.

Abstract

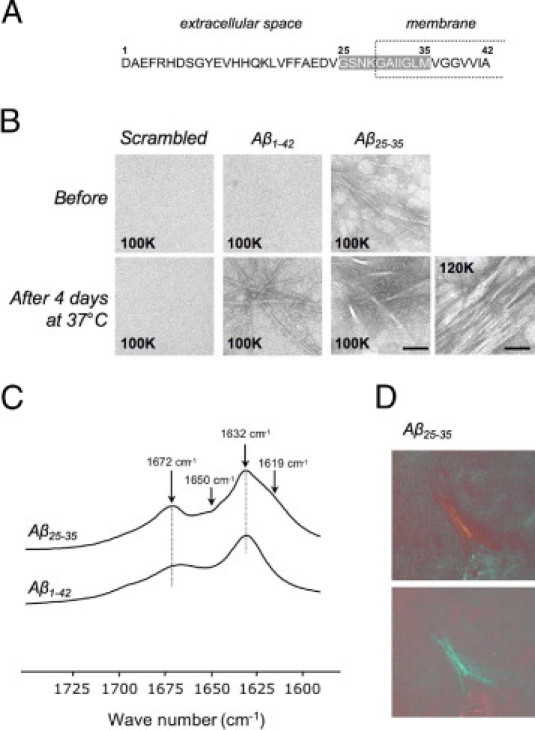
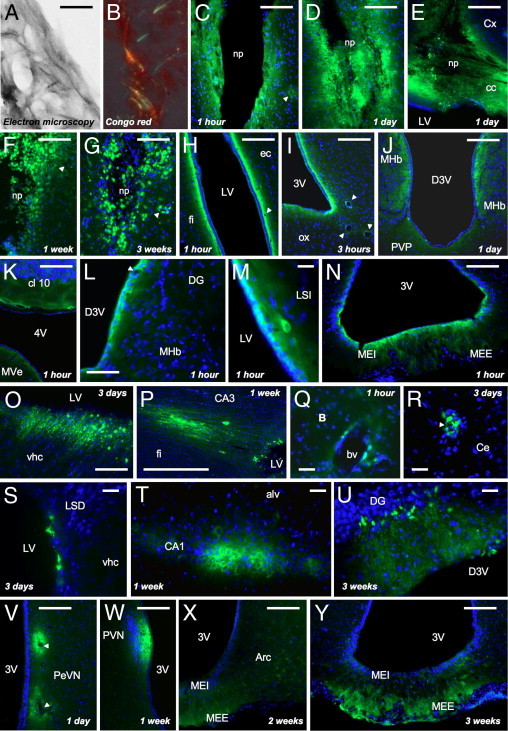
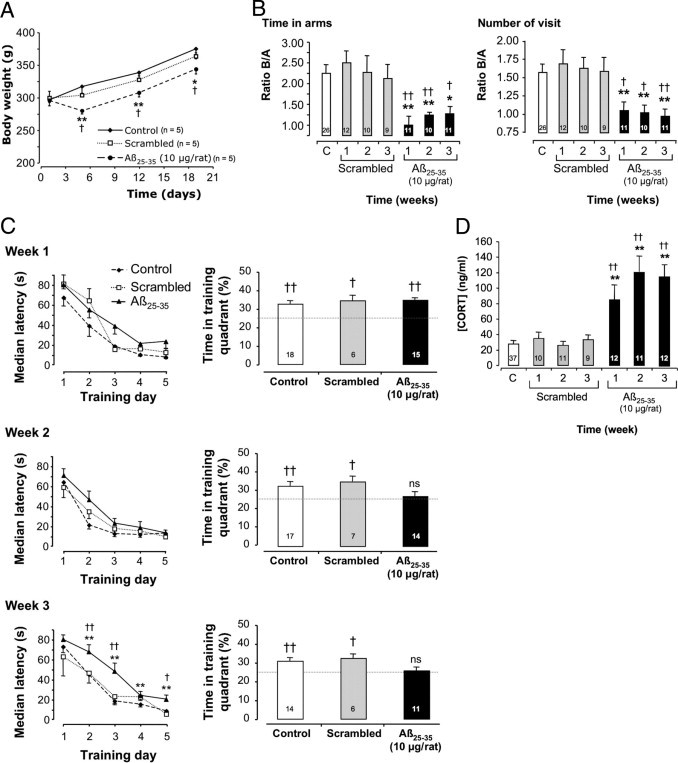
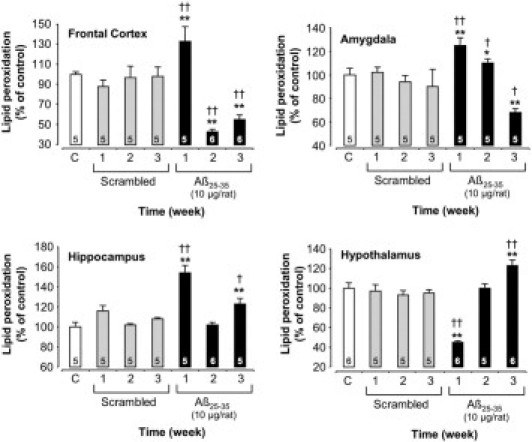
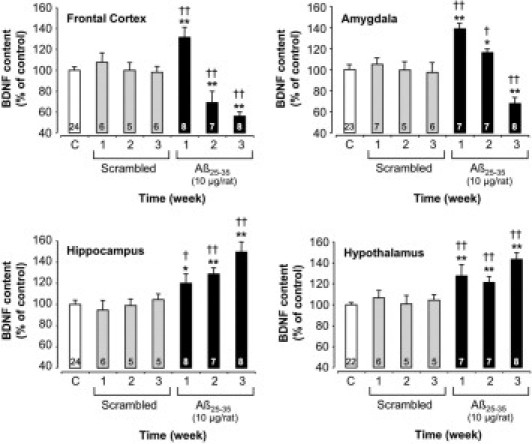
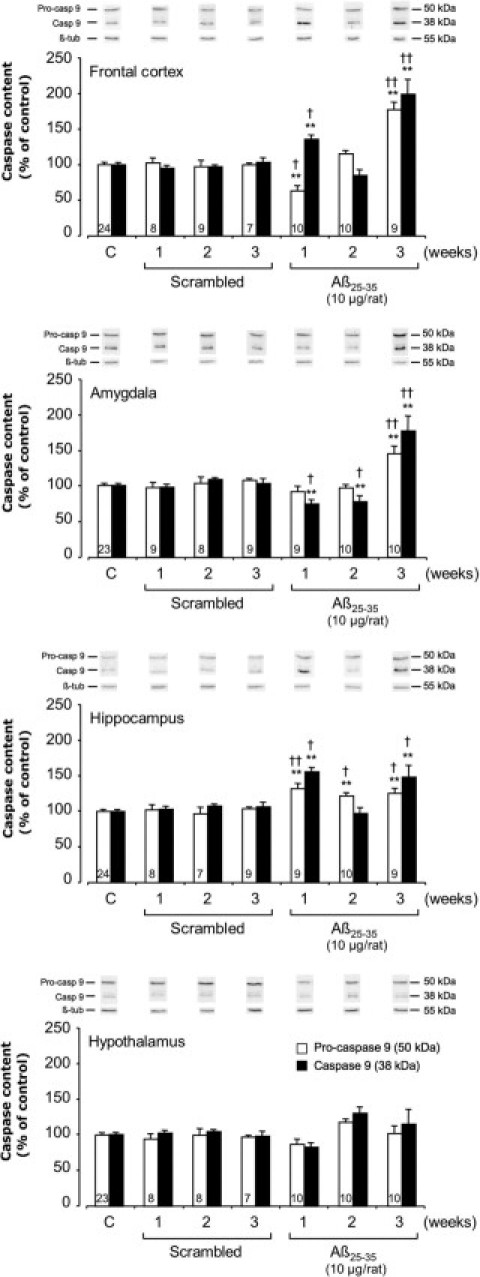
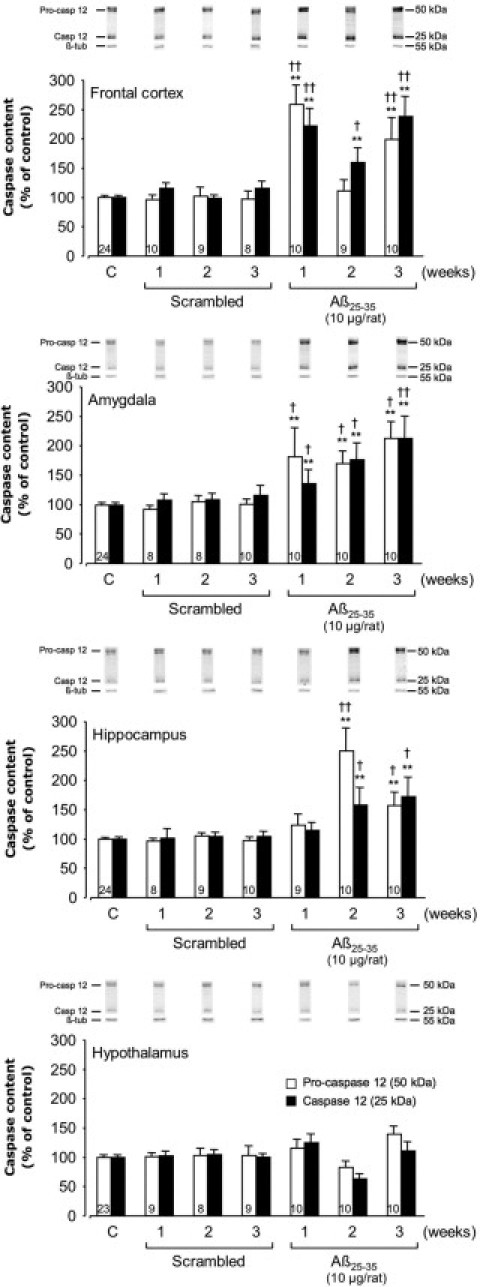
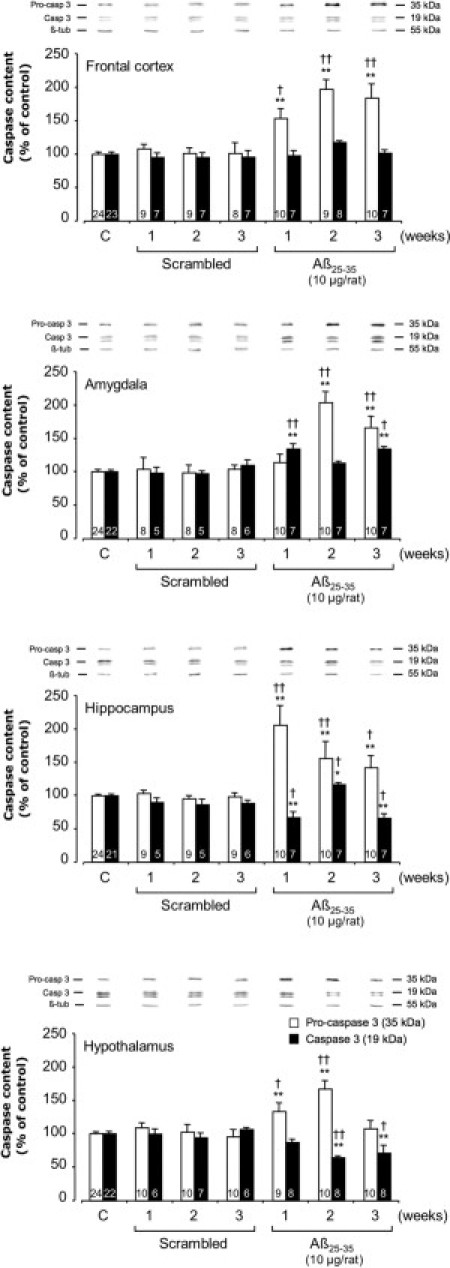
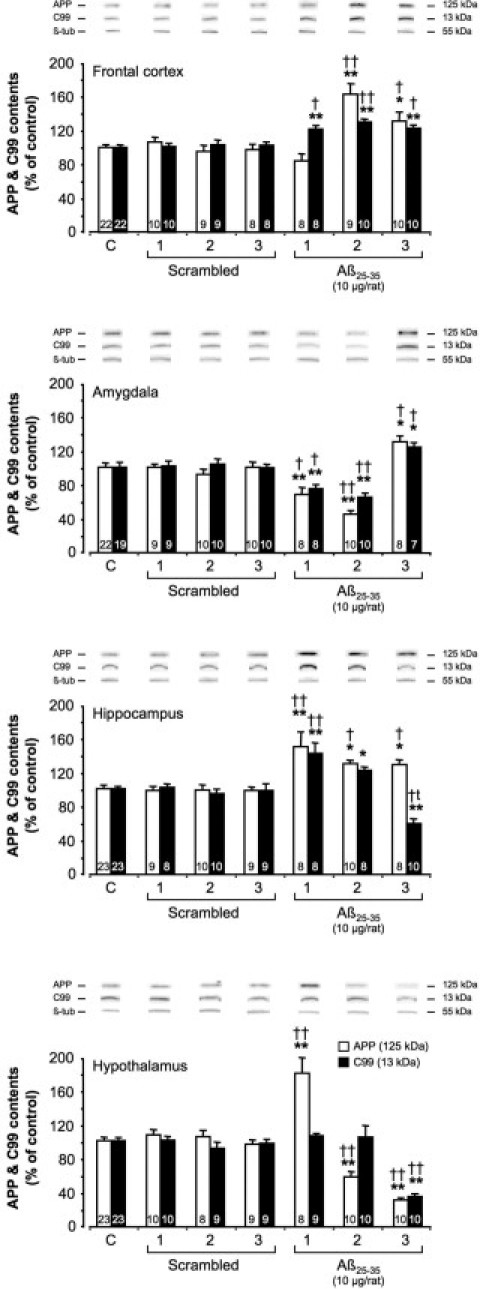
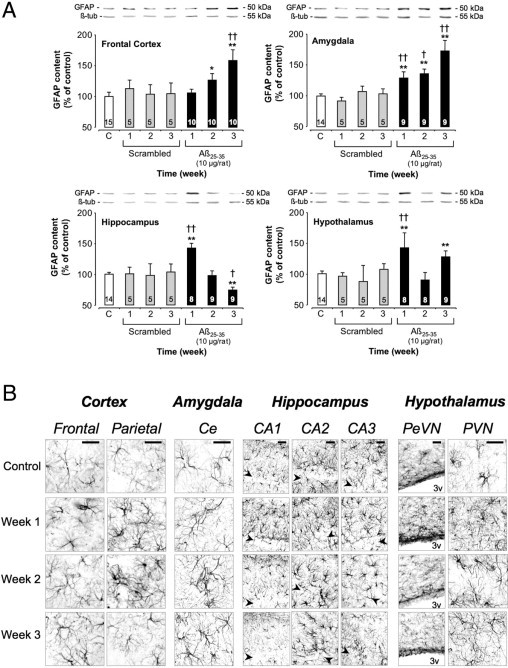
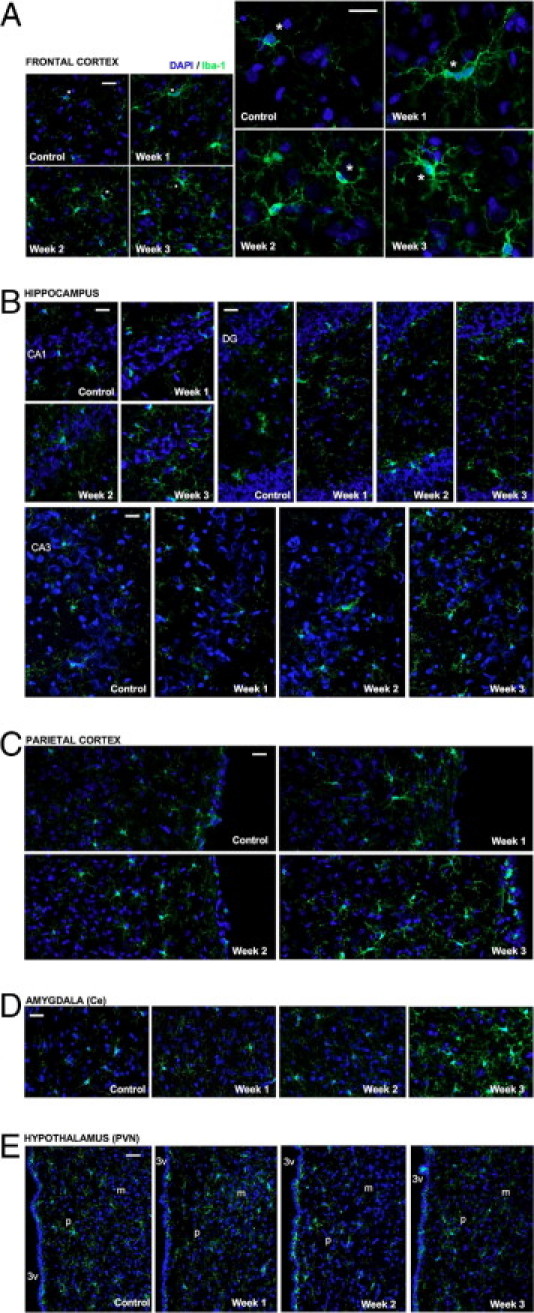
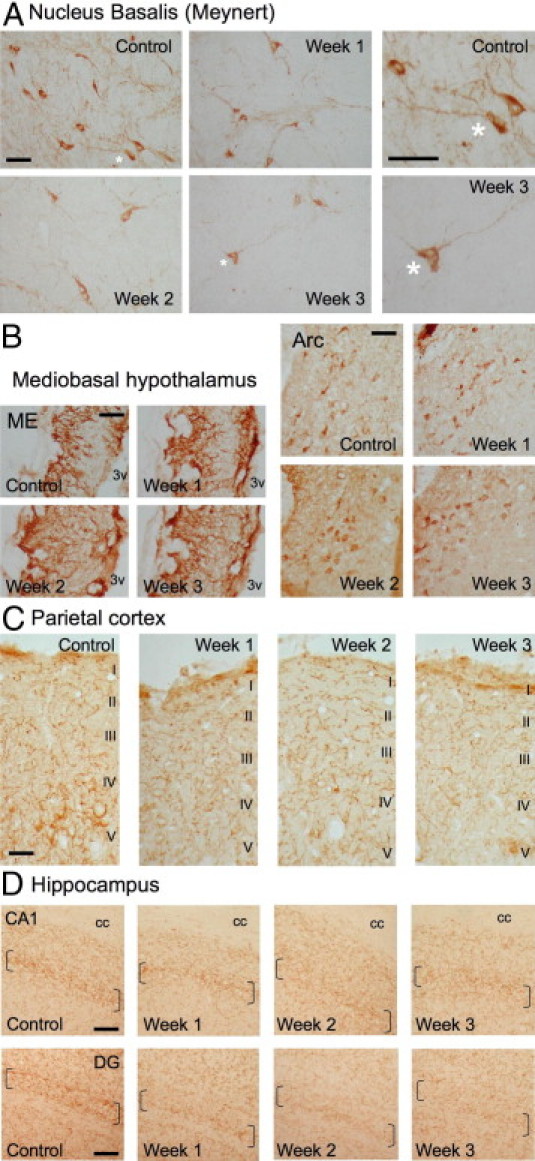
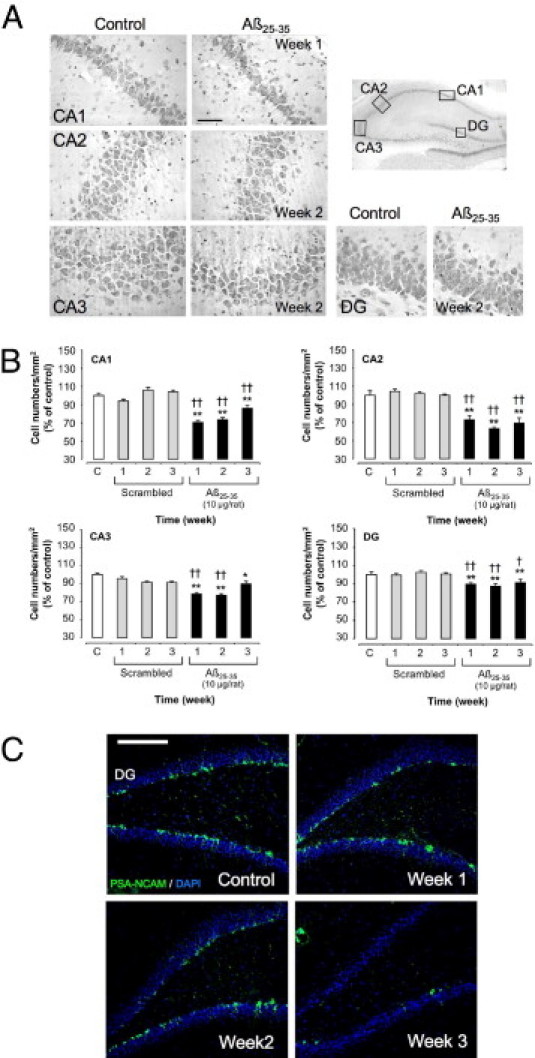
Alzheimer's disease (AD) is a neurodegenerative pathology characterized by the presence of senile plaques and neurofibrillary tangles, accompanied by synaptic and neuronal loss. The major component of senile plaques is an amyloid β protein (Aβ) formed by pathological processing of the Aβ precursor protein. We assessed the time-course and regional effects of a single intracerebroventricular injection of aggregated Aβ fragment 25-35 (Aβ(25-35)) in rats. Using a combined biochemical, behavioral, and morphological approach, we analyzed the peptide effects after 1, 2, and 3 weeks in the hippocampus, cortex, amygdala, and hypothalamus. The scrambled Aβ(25-35) peptide was used as negative control. The aggregated forms of Aβ peptides were first characterized using electron microscopy, infrared spectroscopy, and Congo Red staining. Intracerebroventricular injection of Aβ(25-35) decreased body weight, induced short- and long-term memory impairments, increased endocrine stress, cerebral oxidative and cellular stress, neuroinflammation, and neuroprotective reactions, and modified endogenous amyloid processing, with specific time-course and regional responses. Moreover, Aβ(25-35), the presence of which was shown in the different brain structures and over 3 weeks, provoked a rapid glial activation, acetylcholine homeostasis perturbation, and hippocampal morphological alterations. In conclusion, the acute intracerebroventricular Aβ(25-35) injection induced substantial central modifications in rats, highly reminiscent of the human physiopathology, that could contribute to physiological and cognitive deficits observed in AD.


Figures

Figure 1
Figure 1
A: Amino acid sequence of Aβ1-42. Shading indicates the Aβ25-35 sequence; the intramembrane domain is indicated by a dashed box. B: Electron microscopy of scrambled Aβ25-35, Aβ1-42, and Aβ25-35 peptides before and after in vitro incubation at 37°C for 4 days. Aβ1-42 and Aβ25-35 formed an extensive network of fibrils after 4 days at 37°C, but scrambled peptide did not; the image at the far right presents a higher-magnification view for the Aβ25-35 after incubation. Original magnification, ×100,000 (100K; scale bar = 50 nm) or ×120,000 (120K; scale bar = 60 nm). C: Fourier-transformed IR spectra of Aβ1-42 and Aβ25-35 peptides preaggregated in vitro at 37°C for 4 days. The spectrum of Aβ25-35 aggregates revealed two additional bands at 1619 and 1650 cm−1, compared with the spectrum of Aβ1-42 aggregates. D: Congo Red staining of Aβ25-35 peptide preaggregated in vitro at 37°C for 4 days. The Congo Red-stained sample was viewed under polarized light. The green birefringence was observed in preaggregated Aβ25-35 samples.
Figure 2
Figure 2
A: Electron microscopy of Aβ25-35-HLF peptide after in vitro incubation at 37°C for 4 days. Aβ25-35-HLF formed an extensive network of fibrils after 4 days at 37°C. Scale bar = 120 nm. B: Congo Red staining of Aβ25-35-HLF peptide preaggregated in vitro at 37°C for 4 days. Green birefringence was observed in preaggregated Aβ25-35-HLF. C–Y: Localization within brain structures of Aβ25-35-HLF, determined at 1, 3, and 12 hours, 1 and 3 days, and 1, 2, and 3 weeks after intracerebroventricular injection. Aβ25-35-HLF was visualized in green; the nucleus was counterstained with DAPI (blue). alv, alveus of the hippocampus; Arc, arcuate hypothalamic nucleus; B, basal nucleus of Meynert; bv, blood vessel; CA1, field CA1 of hippocampus; CA3, field CA3 of the hippocampus; cc, corpus callosum; Ce, central amygdala nucleus; cl 10, cerebellar lobule 10; Cx, cerebral cortex; D3V, dorsal third ventricle; DG, dentate gyrus; ec, external capsule; fi, fimbria of the hippocampus; LSD, lateral septal nucleus–dorsal part; LSI, lateral septal nucleus–intermediate part; LV, lateral ventricle; MEE, median eminence–external part; MEI, median eminence–internal part; MHb, medial habenular nucleus; MVe, medial vestibular nucleus; np, needle path; ox, optic chiasma; PeVN, periventricular hypothalamic nucleus; PVN, paraventricular hypothalamic nucleus; PVP, paraventricular thalamic nucleus–posterior part; vhc, ventral hippocampal commissure; 3V, third ventricle; 4V, fourth ventricle. Arrowheads indicate blood vessels. Scale bars = 100 μm.
Figure 3
Figure 3
A: Time-course effects of Aβ25-35 injection (10 μg/rat i.c.v.) on body weight. The injection of the scrambled Aβ25-35 peptide (10 μg/rat i.c.v.) served as negative control. Results are expressed as means ± SEM (n = 5 per group). Two-way repeated-measures analysis of variance: F2,36 = 4.19 (P < 0.05) for treatment; F3,36 = 203.9 (P < 0.0001) for time; and F6,36 = 7.58 (P < 0.0001) for the interaction. *P < 0.05, **P < 0.01 versus control value at the same time; P < 0.05 versus scrambled group value at the same time. B: Time-course effects of Aβ25-35 injection (10 μg/rat i.c.v.) on the ability of rats to perform a spatial short-term memory task (T-maze). During training, only arm A was available for exploration. During retention, performed with an intertrial time interval of 10 minutes, both arms were available. Results show the time spent and number of visits, in terms of arm B/arm A ratios. The injection of scrambled Aβ25-35 peptide (10 μg/rat i.c.v.) served as negative control. Results are expressed as means ± SEM. One-way analysis of variance: F6,82 = 3.00 (P < 0.01) for time; F6,82 = 3.04 (P < 0.01) for number of visits. *P < 0.05, **P < 0.01 versus noninjected rats [control group (C)]; P < 0.05, ††P < 0.01 versus respective scrambled peptide-treated rats. The number of animals per group is indicated on data bars. C: Time-course effects of Aβ25-35 intracerebroventricular injection on rat behavior in a spatial long-term memory test (water maze). Animals were subjected to three swims per day for 5 days (90 seconds duration with an intertrial time interval of 20 minutes) to find the platform. The injection of scrambled Aβ25-35 peptide (10 μg/rat i.c.v.) served as negative control. Results are expressed as means ± SEM. Two-way repeated-measures analysis of variance: at week 1, F2,260 = 10.2 (P < 0.0001) for treatment, F4,260 = 133 (P < 0.0001) for trials, and F8,260 = 1.85 (P > 0.05) for the interaction; at week 2, F2,268 = 2.44 (P > 0.05) for treatment, F4,268 = 123 (P < 0.0001) for trials, and F8,268 = 0.73 (P > 0.05) for the interaction; and at week 3, F2,268 = 20.8 (P < 0.0001) for treatment, F4,268 = 125 (P < 0.0001) for trials, and F8,268 = 2.37 (P < 0.05) for the interaction. *P < 0.05, **P < 0.01 versus control noninjected rats; P < 0.05, ††P < 0.01 versus respective scrambled peptide treated rats. The probe test was performed 4 hours after the last training trial in a single swim (60 seconds duration) without platform. The presence in the training quadrant was analyzed versus the chance level (25%). P < 0.05, ††P < 0.01; ns, nonsignificant. The number of animals per group is indicated within the probe test data bars. D: Variations in plasma corticosterone (CORT) levels determined in rats at 1, 2, and 3 weeks after injection of Aβ25-35 scrambled peptide (10 μg/rat i.c.v., negative control) or Aβ25-35 (10 μg/rat i.c.v.). The values are expressed as means ± SEM. One-way analysis of variance: F6,95 = 22.36 (P < 0.0001). **P < 0.01 versus control noninjected rats [control group (C)]; ††P < 0.01 versus respective scrambled peptide-treated rats. The number of animals per group is indicated on data bars.
Figure 4
Figure 4
Variations in lipid peroxidation levels in the frontal cortex, amygdala, hippocampus, and hypothalamus determined in rats at 1, 2, and 3 weeks after injection of scrambled Aβ25-35 peptide (10 μg/rat i.c.v., negative control) or Aβ25-35 (10 μg/rat i.c.v.). Results are expressed as means ± SEM. One-way analysis of variance: frontal cortex, F6,30 = 8.37 (P < 0.0001); amygdala, F6,28 = 8.17 (P < 0.0001); hippocampus, F6,29 = 24.42 (P < 0.0001); and hypothalamus, F6,31 = 16.08 (P < 0.0001). *P < 0.05, **P < 0.01 versus control noninjected rats [control group (C)]; P < 0.05, ††P < 0.01 versus respective scrambled peptide treated rats. The number of animals per group is indicated on data bars.
Figure 5
Figure 5
Variations in BDNF content in the frontal cortex, amygdala, hippocampus, and hypothalamus determined in rats at 1, 2, and 3 weeks after injection of scrambled Aβ25-35 peptide (10 μg/rat i.c.v., negative control) or Aβ25-35 (10 μg/rat i.c.v.). Results are expressed as means ± SEM. One-way analysis of variance: frontal cortex, F6,57 = 9.05 (P < 0.0001); amygdala, F6,56 = 8.58 (P < 0.0001); hippocampus, F6,56 = 8.03 (P < 0.0001); and hypothalamus, F6,54 = 8.65 (P < 0.0001). *P < 0.05, **P < 0.01 versus control noninjected rats [control group (C)]; P < 0.05, ††P < 0.01 versus respective scrambled peptide treated rats. The number of animals per group is indicated on data bars.
Figure 6
Figure 6
Variations in pro- and activated caspase-9 levels in the frontal cortex, amygdala, hippocampus, and hypothalamus determined in rats by Western blotting at 1, 2, and 3 weeks after injection of scrambled Aβ25-35 peptide (10 μg/rat i.c.v., negative control) or Aβ25-35 (10 μg/rat i.c.v.). Pro-caspase-9 (50 kDa) and activated caspase-9 (38 kDa) variations were normalized with those of β-tubulin (β-tub; 55 kDa) and were compared with noninjected rats [control group (C)]. Results are expressed as means ± SEM. One-way analysis of variance: frontal cortex, F6,71 = 9.51 (P < 0.0001) for pro-caspase-9 and F6,71 = 8.12 (P < 0.0001) for cleaved caspase-9; amygdala, F6,72 = 7.06 (P < 0.0001) and F6,72 = 17.08 (P < 0.0001) for the two caspase-9 forms, respectively; hippocampus, F6,70 = 4.36 (P < 0.001) and F6,70 = 3.56 (P < 0.01) for the two forms, respectively; and hypothalamus, F6,71 = 0.99 (P > 0.05) and F6,71 = 2.09 (P > 0.05) for the two forms. **P < 0.01 versus control noninjected rats [control group (C)]; P < 0.05, ††P < 0.01 versus respective scrambled peptide treated rats. The number of animals per group for both caspase forms is indicated on white data bars.
Figure 7
Figure 7
Variations in pro- and activated caspase-12 levels in the frontal cortex, amygdala, hippocampus, and hypothalamus determined in rats by Western blotting at 1, 2, and 3 weeks after injection of scrambled Aβ25-35 peptide (10 μg/rat i.c.v., negative control) or Aβ25-35 (10 μg/rat i.c.v.). Pro-caspase-12 (50 kDa) and activated caspase-12 (25 kDa) variations were normalized with those of β-tubulin (β-tub, 55 kDa) and were compared with untreated rats [control group (C)]. Results are expressed as means ± SEM. One-way analysis of variance: frontal cortex, F6,74 = 12.93 (P < 0.0001) for pro-caspase-12 and F6,74 = 14.85 (P < 0.0001) for cleaved caspase-12; amygdala, F6,74 = 4.84 (P < 0.001) and F6,74 = 6.58 (P < 0.0001) for the two caspase-12 forms, respectively; hippocampus, F6,74 = 10.42 (P < 0.0001) and F6,74 = 3.56 (P < 0.01) for the two forms, respectively; and hypothalamus, F6,73 = 1.92 (P > 0.05) and F6,73 = 1.80 (P > 0.05) for the two forms. **P < 0.01 versus control noninjected rats [control group (C)]; P < 0.05, ††P < 0.01 versus respective scrambled peptide treated rats. The number of animals per group for both caspase forms is indicated on white data bars.
Figure 8
Figure 8
Variations in pro- and activated caspase-3 levels in the frontal cortex, amygdala, hippocampus, and hypothalamus determined in rats by Western blotting at 1, 2, and 3 weeks after injection of scrambled Aβ25-35 peptide (10 μg/rat i.c.v., negative control) or Aβ25-35 (10 μg/rat i.c.v.). Pro-caspase-3 (35 kDa) and activated caspase-3 (19 kDa) variations were normalized with those of β-tubulin (β-tub, 55 kDa) and were compared with untreated rats [control group (C)]. Results are expressed as means ± SEM. One-way analysis of variance: frontal cortex, F6,72 = 15.9 (P < 0.0001) for pro-caspase-3 and F6,60 = 1.06 (P > 0.05) for cleaved-caspase-3; amygdala, F6,72 = 14.0 (P < 0.0001) and F6,53 = 7.42 (P < 0.0001) for the two caspase-3 forms, respectively; hippocampus, F6,75 = 9.91 (P < 0.0001) and F6,52 = 8.01 (P < 0.0001) for the two forms, respectively; and hypothalamus, F6,77 = 8.74 (P < 0.0001) and F6,59 = 6.22 (P < 0.0001) for the two forms. *P < 0.05, **P < 0.01 versus control noninjected rats [control group (C)]; P < 0.05, ††P < 0.01 versus respective scrambled peptide treated rats. The number of animals per group is indicated on data bars.
Figure 9
Figure 9
Variations in APP and C99 levels in the frontal cortex, amygdala, hippocampus, and hypothalamus determined in rats by Western blotting at 1, 2, and 3 weeks after injection of scrambled Aβ25-35 peptide (10 μg/rat i.c.v., negative control) or Aβ25-35 (10 μg/rat i.c.v.). APP (125 kDa) and C99 (13 kDa) variations were normalized with those of β-tubulin (β-tub, 55 kDa) and compared with noninjected rats [control group (C)]. Results are expressed as means ± SEM. One-way analysis of variance: frontal cortex, F6,69 = 12.3 (P < 0.0001) for APP and F6,70 = 9.72 (P < 0.0001) for C99; amygdala, F6,70 = 16.9 (P < 0.0001) for APP and F6,66 = 13.9 (P < 0.0001) for C99; hippocampus, F6,70 = 8.21 (P < 0.001) for APP and F6,69 = 16.1 (P < 0.0001) for C99; and hypothalamus, F6,71 = 37.3 (P < 0.0001) for APP and F6,73 = 15.0 (P < 0.0001) for C99. *P < 0.05, **P < 0.01 versus control noninjected rats [control group (C)]; P < 0.05, ††P < 0.01 versus respective scrambled peptide-treated rats. The number of animals per group is indicated on data bars.
Figure 10
Figure 10
A: Variations in GFAP levels in the frontal cortex, amygdala, hippocampus, and hypothalamus determined in rats by Western blotting at 1, 2, and 3 weeks after injection of scrambled Aβ25-35 peptide (10 μg/rat i.c.v., negative control) or Aβ25-35 (10 μg/rat i.c.v.). GFAP (50 kDa) variations were normalized with those of β-tubulin (β-tub, 55 kDa) and were compared with untreated rats [control group (C)]. Results are expressed as means ± SEM. One-way analysis of variance: frontal cortex, F6,53 = 5.28 (P < 0.001); amygdala, F6,49 = 12.5 (P < 0.0001); hippocampus, F6,48 = 5.21 (P < 0.001); and hypothalamus, F6,47 = 4.98 (P < 0.001). *P < 0.05, **P < 0.01 versus control group; P < 0.05, ††P < 0.01 versus respective scrambled peptide treated rats. The number of animals per group is indicated on data bars. B: Time-course effects of Aβ25-35 (10 μg/rat) intracerebroventricular injection on astrocyte reaction using GFAP immunolabeling in the frontal and parietal cortex, amygdala, hippocampus, and hypothalamus determined in control untreated rats and at 1, 2, and 3 weeks after Aβ25-35 injection. The injection of the Aβ25-35 scrambled peptide (10 μg/rat i.c.v.) served as negative control and induced no modifications in the GFAP signal. CAn, hippocampal subfields; Ce, central amygdaloid nucleus; PeVN, periventricular nucleus; PVN, paraventricular nucleus; 3v: third ventricle. Arrowheads indicate the hippocampus layer of granular cells. Scale bars = 100 μm.
Figure 11
Figure 11
Time-course effects of Aβ25-35 (10 μg/rat) intracerebroventricular injection on the microglial reaction using Iba-1 immunolabeling in the frontal cortex (A), hippocampus CA1, CA3, and DG subfields (B), parietal cortex (C), amygdala (D), and hypothalamus paraventricular nucleus (E) determined in untreated rats [control group (C)] and at 1, 2, and 3 weeks after Aβ25-35 injection. The injection of the Aβ25-35 scrambled peptide (10 μg/rat i.c.v.) served as negative control and induced no modifications of the Iba-1 signal. Activated microglia were visualized with Alexa Fluor 488-labeled specific antibody against Iba-1 (green); the nucleus was counterstained with DAPI (blue). In A, asterisks indicate matching locations in corresponding images presented at both lower and higher magnification. CAn, hippocampal subfields; Ce, central amygdaloid nucleus; DG, dentate gyrus; m, magnocellular; p, parvocellular; PVN, paraventricular hypothalamic nucleus; 3v, third ventricle. Scale bars = 100 μm.
Figure 12
Figure 12
Time-course effects of Aβ25-35 (10 μg/rat) intracerebroventricular injection on VAChT immunolabeling within the nucleus basalis of Meynert (A), mediobasal hypothalamus (B), parietal cortex with levels I to V cortical layers indicated (C), and hippocampus (D) were determined in control untreated rats and at 1, 2, and 3 weeks after Aβ25-35 injection. In A, asterisks indicate matching locations in corresponding images presented at both lower and higher magnification. In D, brackets locate the hippocampus granular cell layers. Arc, arcuate nucleus; cc, corpus callosum; ME, median eminence; 3v, third ventricle. Scale bars = 100 μm.
Figure 13
Figure 13
A: Time-course effects of Aβ25-35 injection (10 μg/rat i.c.v.) on hippocampus pyramidal cell numbers. Representative microphotographs of coronal sections of cresyl violet-stained hippocampus CA1, CA2, CA3, and DG subfields, obtained in control untreated rats and after Aβ25-35 intracerebroventricular injection. Scale bar = 100 μm. B: Average numbers of hippocampus pyramidal cells determined in untreated rats [control group (C)] and at 1, 2, and 3 weeks after the injection of scrambled Aβ25-35 peptide (10 μg/rat i.c.v., negative control) or Aβ25-35 (10 μg/rat i.c.v.). Results are expressed as means ± SEM (n = 4 per group). One-way analysis of variance: CA1, F6,21 = 39.6 (P < 0.0001); CA2, F6,21 = 29.1 (P < 0.0001); CA3, F6,21 = 11.8 (P < 0.0001); and DG, F6,21 = 8.40 (P < 0.001). *P < 0.05, **P < 0.01 versus control rats; P < 0.05, ††P < 0.01 versus scrambled peptide treated rats. C: Effects of Aβ25-35 (10 μg/rat) intracerebroventricular injection on hippocampus DG neurogenesis using PSA-NCAM immunolabeling, determined in untreated control rats and at 1, 2, and 3 weeks after Aβ25-35 intracerebroventricular injection. The injection of scrambled amyloid peptide (10 μg/rat i.c.v.) served as negative control and induced no modifications in the PSA-NCAM signal. Neurogenesis was visualized in coronal sections of the DG with Alexa Fluor 488-labeled specific antibody against PSA-NCAM (green); the nucleus was counterstained with DAPI (blue). Scale bar = 200 μm.

Similar articles

Cited by

References

    1. Selkoe D.J. Translating cell biology into therapeutic advances in Alzheimer's disease. Nature. 1999;399(6738 Suppl):A23–A31. - PubMed
    1. Yankner B.A. Mechanisms of neuronal degeneration in Alzheimer's disease. Neuron. 1996;16:921–932. - PubMed
    1. Selkoe D.J. Alzheimer's disease: genes, proteins, and therapy. Physiol Rev. 2001;81:741–766. - PubMed
    1. Pike C.J., Cummings B.J., Cotman C.W. Beta-amyloid induces neuritic dystrophy in vitro: similarities with Alzheimer pathology. Neuroreport. 1992;3:769–772. - PubMed
    1. Pike C.J., Walencewicz-Wasserman A.J., Kosmoski J., Cribbs D.H., Glabe C.G., Cotman C.W. Structure-activity analyses of beta-amyloid peptides: contributions of the beta 25–35 region to aggregation and neurotoxicity. J Neurochem. 1995;64:253–265. - PubMed