

Metastatic progression of prostate cancer and e-cadherin regulation by zeb1 and SRC family kinases
- PMID: 21703419
- PMCID: PMC3123858
- DOI: 10.1016/j.ajpath.2011.03.028
Metastatic progression of prostate cancer and e-cadherin regulation by zeb1 and SRC family kinases
Abstract
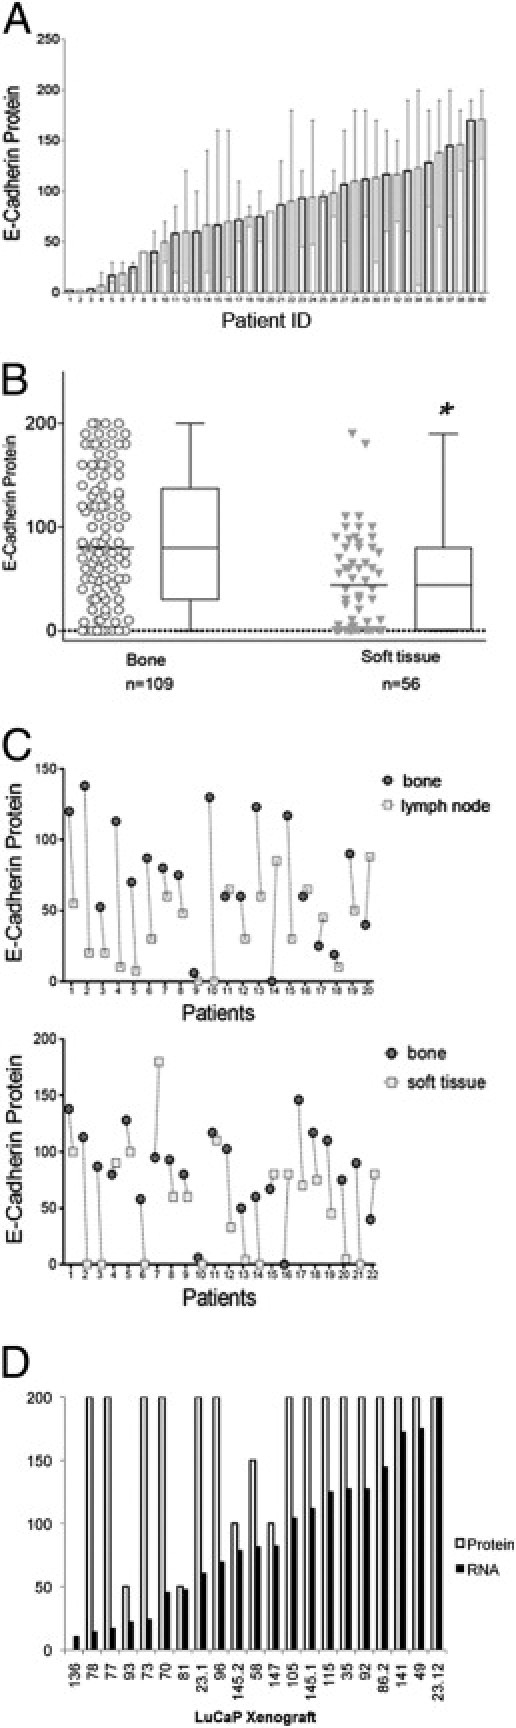
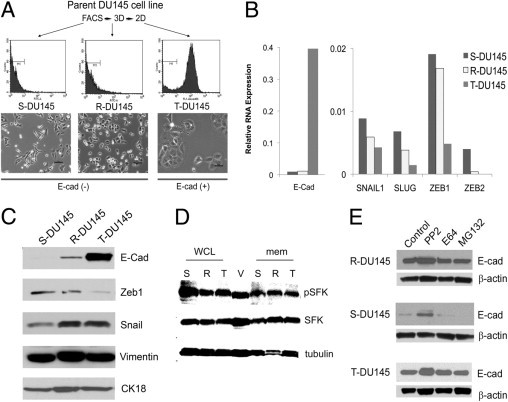
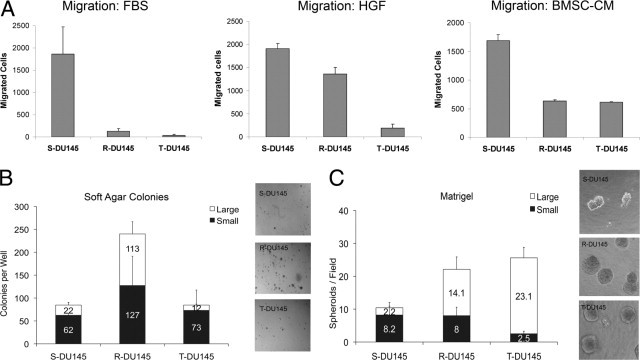
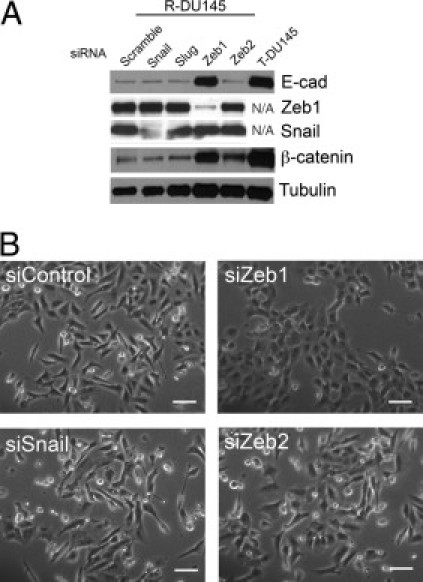
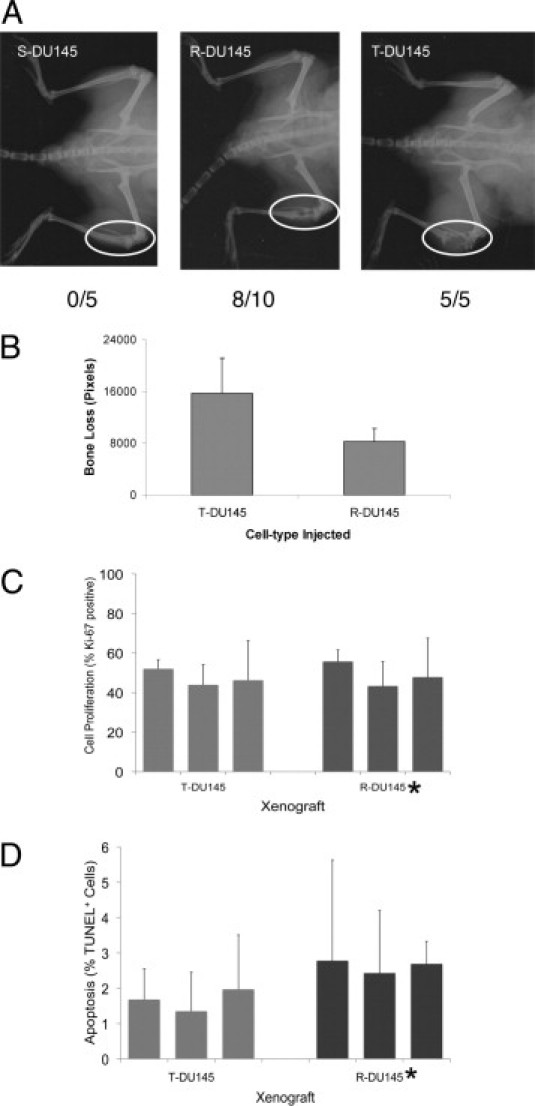
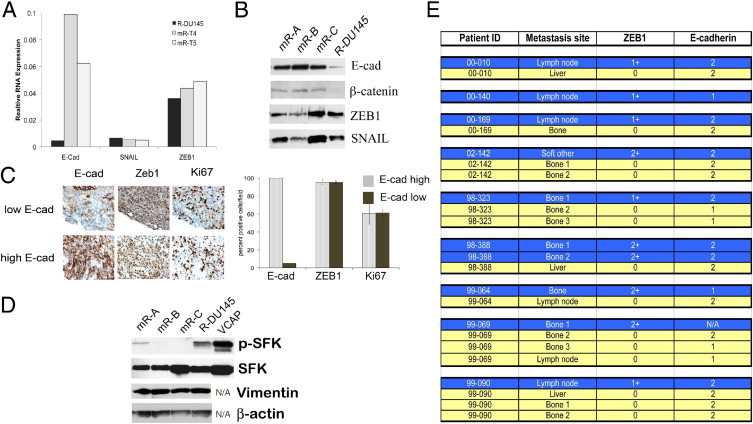
Expression of E-cadherin is used to monitor the epithelial phenotype, and its loss is suggestive of epithelial-mesenchymal transition (EMT). EMT triggers tumor metastasis. Exit from EMT is marked by increased E-cadherin expression and is considered necessary for tumor growth at sites of metastasis; however, the mechanisms associated with exit from EMT are poorly understood. Herein are analyzed 185 prostate cancer metastases, with significantly higher E-cadherin expression in bone than in lymph node and soft tissue metastases. To determine the molecular mechanisms of regulation of E-cadherin expression, three stable isogenic cell lines from DU145 were derived that differ in structure, migration, and colony formation on soft agar and Matrigel. When injected into mouse tibia, the epithelial subline grows most aggressively, whereas the mesenchymal subline does not grow. In cultured cells, ZEB1 and Src family kinases decrease E-cadherin expression. In contrast, in tibial xenografts, E-cadherin RNA levels increase eight- to 10-fold despite persistent ZEB1 expression, and in all ZEB1-positive metastases (10 of 120), ZEB1 and E-cadherin proteins were co-expressed. These data suggest that transcriptional regulation of E-cadherin differs in cultured cells versus xenografts, which more faithfully reflect E-cadherin regulation in cancers in human beings. Furthermore, the aggressive nature of xenografts positive for E-cadherin and the frequency of metastases positive for E-cadherin suggest that high E-cadherin expression in metastatic prostate cancer is associated with aggressive tumor growth.
Copyright © 2011 American Society for Investigative Pathology. Published by Elsevier Inc. All rights reserved.
Figures
Similar articles
-
Insulin-like growth factor-I-dependent up-regulation of ZEB1 drives epithelial-to-mesenchymal transition in human prostate cancer cells.Cancer Res. 2008 Apr 1;68(7):2479-88. doi: 10.1158/0008-5472.CAN-07-2559. Cancer Res. 2008. PMID: 18381457
-
Roles of STAT3 and ZEB1 proteins in E-cadherin down-regulation and human colorectal cancer epithelial-mesenchymal transition.J Biol Chem. 2012 Feb 17;287(8):5819-32. doi: 10.1074/jbc.M111.295964. Epub 2011 Dec 28. J Biol Chem. 2012. PMID: 22205702 Free PMC article.
-
An hTERT/ZEB1 complex directly regulates E-cadherin to promote epithelial-to-mesenchymal transition (EMT) in colorectal cancer.Oncotarget. 2016 Jan 5;7(1):351-61. doi: 10.18632/oncotarget.5968. Oncotarget. 2016. PMID: 26540342 Free PMC article.
-
Src-mediated regulation of E-cadherin and EMT in pancreatic cancer.Front Biosci (Landmark Ed). 2012 Jun 1;17(6):2059-69. doi: 10.2741/4037. Front Biosci (Landmark Ed). 2012. PMID: 22652764 Review.
-
Transcription regulation of E-cadherin by zinc finger E-box binding homeobox proteins in solid tumors.Biomed Res Int. 2014;2014:921564. doi: 10.1155/2014/921564. Epub 2014 Aug 13. Biomed Res Int. 2014. PMID: 25197668 Free PMC article. Review.
Cited by
-
Id2 complexes with the SNAG domain of Snai1 inhibiting Snai1-mediated repression of integrin β4.Mol Cell Biol. 2013 Oct;33(19):3795-804. doi: 10.1128/MCB.00434-13. Epub 2013 Jul 22. Mol Cell Biol. 2013. PMID: 23878399 Free PMC article.
-
Analysis of regulator of G-protein signalling 2 (RGS2) expression and function during prostate cancer progression.Sci Rep. 2018 Nov 22;8(1):17259. doi: 10.1038/s41598-018-35332-4. Sci Rep. 2018. PMID: 30467386 Free PMC article.
-
The E-Cadherin and N-Cadherin Switch in Epithelial-to-Mesenchymal Transition: Signaling, Therapeutic Implications, and Challenges.Cells. 2019 Sep 20;8(10):1118. doi: 10.3390/cells8101118. Cells. 2019. PMID: 31547193 Free PMC article. Review.
-
Stromal expression of decorin, Semaphorin6D, SPARC, Sprouty1 and Tsukushi in developing prostate and decreased levels of decorin in prostate cancer.PLoS One. 2012;7(8):e42516. doi: 10.1371/journal.pone.0042516. Epub 2012 Aug 3. PLoS One. 2012. PMID: 22880013 Free PMC article.
-
Dishonorable discharge: the oncogenic roles of cleaved E-cadherin fragments.Cancer Res. 2012 Jun 15;72(12):2917-23. doi: 10.1158/0008-5472.CAN-11-3498. Epub 2012 Jun 1. Cancer Res. 2012. PMID: 22659456 Free PMC article. Review.
References
-
- Huber M.A., Kraut N., Beug H. Molecular requirements for epithelial-mesenchymal transition during tumor progression. Curr Opin Cell Biol. 2005;17:548–558. - PubMed
-
- Zeisberg M., Kalluri R. The role of epithelial-to-mesenchymal transition in renal fibrosis. J Mol Med. 2004;82:175–181. - PubMed
-
- Halbleib J.M., Nelson W.J. Cadherins in development: cell adhesion, sorting, and tissue morphogenesis. Genes Dev. 2006;20:3199–3214. - PubMed
-
- Cavallaro U., Christofori G. Multitasking in tumor progression: signaling functions of cell adhesion molecules. Ann NY Acad Sci. 2004;1014:58–66. - PubMed
-
- Peinado H., Olmeda D., Cano A. Snail, Zeb and bHLH factors in tumour progression: an alliance against the epithelial phenotype? Nat Rev Cancer. 2007;7:415–428. - PubMed
Publication types
MeSH terms
Substances
Grants and funding
LinkOut - more resources
Full Text Sources
Medical
Miscellaneous
