. 2011 Jun 24;145(7):1023-35.
doi: 10.1016/j.cell.2011.05.026.

Residual embryonic cells as precursors of a Barrett's-like metaplasia

Affiliations

Residual embryonic cells as precursors of a Barrett's-like metaplasia

Xia Wang et al. Cell. .

Abstract

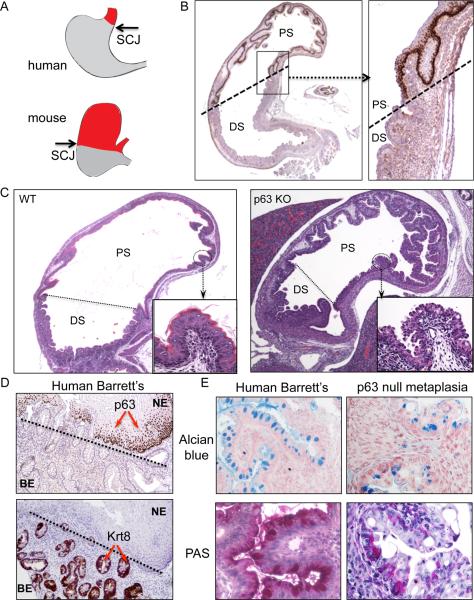
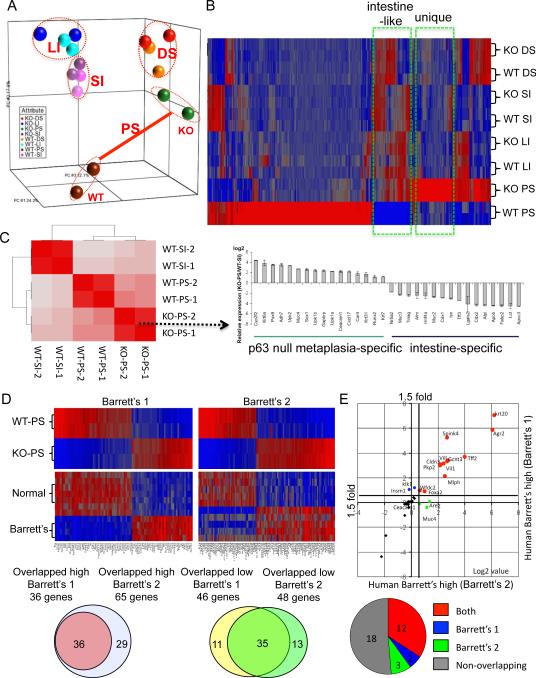
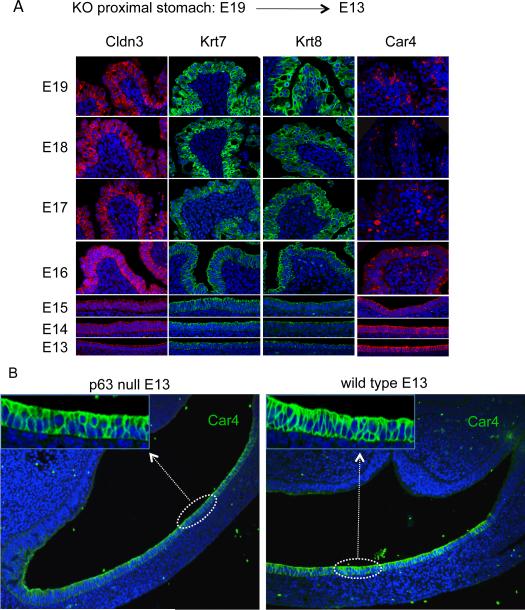
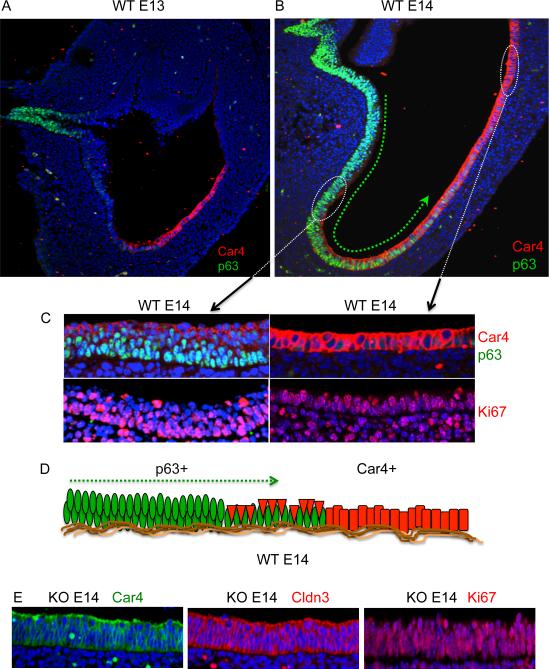
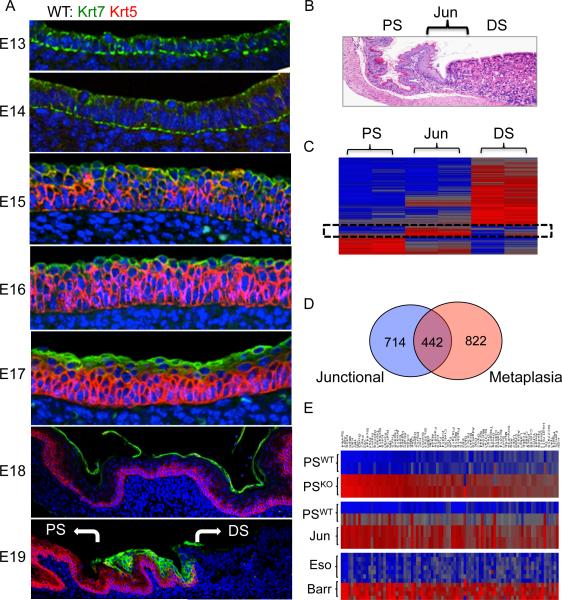
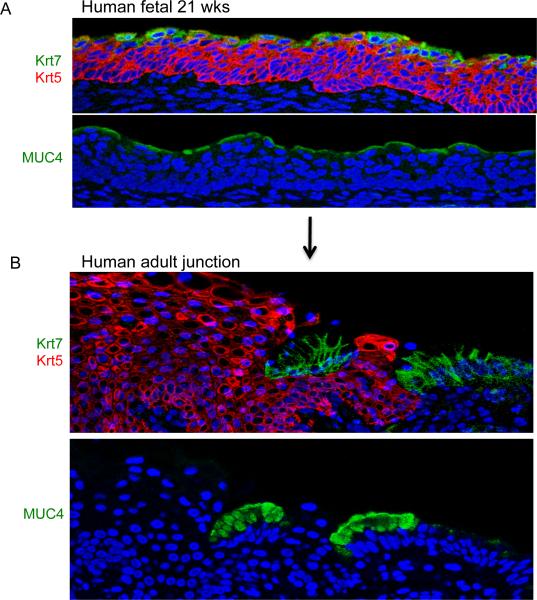
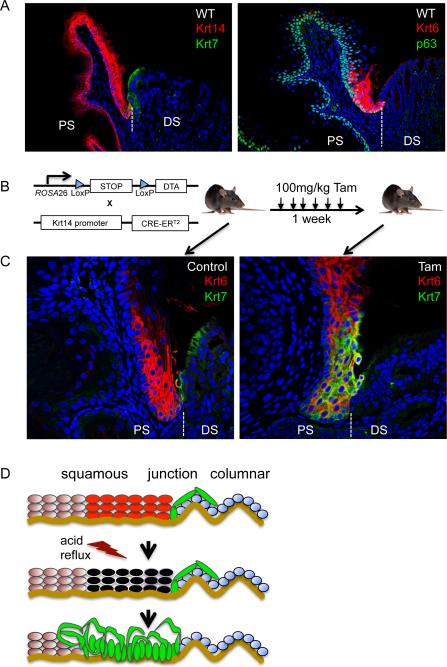
Barrett's esophagus is an intestine-like metaplasia and precursor of esophageal adenocarcinoma. Triggered by gastroesophageal reflux disease, the origin of this metaplasia remains unknown. p63-deficient mice, which lack squamous epithelia, may model acid-reflux damage. We show here that p63 null embryos rapidly develop intestine-like metaplasia with gene expression profiles similar to Barrett's metaplasia. We track its source to a unique embryonic epithelium that is normally undermined and replaced by p63-expressing cells. Significantly, we show that a discrete population of these embryonic cells persists in adult mice and humans at the squamocolumnar junction, the source of Barrett's metaplasia. We show that upon programmed damage to the squamous epithelium, these embryonic cells migrate toward adjacent, specialized squamous cells in a process that may recapitulate early Barrett's. Our findings suggest that certain precancerous lesions, such as Barrett's, initiate not from genetic alterations but from competitive interactions between cell lineages driven by opportunity.


Figures

Figure 1
Figure 1
Metaplasia in the proximal stomach of p63 null embryos A. Schematic representation of the human and murine upper gastrointestinal tract showing the respective positions of the squamous (red) and glandular tissues (gray) and intervening squamocolumnar junction. B. Histological section through the stomach of an E18 wild type mouse stained with anti-p63 antibodies highlighting the p63-positive squamous epithelia of the proximal stomach (PS) and the glandular epithelium of the distal stomach (DS). C. Comparison of histologically-stained sections through stomachs of E18 wild type (left panel) and p63 null (right panel) embryos with high magnification insets showing squamous tissue lining the proximal stomach of the wild type mouse and columnar epithelia in the p63 mutant animals. D. Histological sections through Barrett's esophagus with both squamous islands and glands of intestinal metaplasia stained with antibodies to p63 (top panel) and to the Barrett's marker Krt8 (bottom panel). E. Comparison of Alcian blue and periodic acid-Schiffs staining of human Barrett's esophagus (left panels) and metaplasia in E19 p63 null proximal stomach (right panels). See also Figure S1.
Figure 2
Figure 2
Gene expression of metaplasia in p63 null embryos A. A three-dimensional representation of a Principle Component Analysis of expression microarray data derived from gastrointestinal tract tissues of E18 wild type (WT) and p63 null (KO) embryos. PS, proximal stomach; DS, distal stomach; LI, large intestine; SI, small intestine. B. Heat map of expression microarray data from gastrointestinal tract anchored by a comparison between wild type and p63 null proximal stomach datasets. C. Hierarchical correlation analysis of whole genome data sets from wild type and p63 null tissues. Histogram depicts expression profiles of genes selected to emphasize metaplasia-specific and intestine-specific genes. D. Heat maps of differentially-expressed genes in wild type and p63 null proximal stomach and corresponding expression patterns in two different datasets of normal human esophagus and Barrett's metaplasia (Barrett's #1 from Stairs et al., 2008; Barrett's #2 from Kimchi et al., 2005). Below, Venn diagrams showing the overlap of genes from the two Barrett's dataset that are also high (or low) in the p63 null metaplasia. E. Scatterplot of up-regulated genes in Barrett's esophagus from two different datasets that are also in the top 50 overexpressed genes in metaplasia of the p63 null mouse. Pie chart indicates relative intersection of 35 most overexpressed gene of p63 null metaplasia with the Barrett's datasets. See also Figure S2, Figure S3, Table S1, Table S2, and Table S3.
Figure 3
Figure 3
Retrospective tracing of metaplasia through embryogenesis A. Fluorescence micrographs of metaplasia in proximal stomach of p63 null embryos from E19 to E13 stained with antibodies to Cldn3, Krt7, Krt8, and Car4 and counterstained with Hoechst dye for DNA (blue). B. Sections through the proximal stomach of E13 p63 null (left) and wild type (right) embryos stained with antibodies to Car4 (green) showing a simple columnar epithelium lining the lumen. Insets at higher magnification. Sections counterstained with Hoechst dye for DNA. See also Figure S4.
Figure 4
Figure 4
Undermining of Car4 cells by p63-positive cells at E14 A., B. Sections through wild type E13 and wild type E14 proximal stomachs, respectively, probed with antibodies to Car4 and p63. Green arrow depicts an apparent anterior-to-posterior gradient of p63 positive cells from esophagus to proximal stomach. C. top left panel, Section through anterior portion of wild type E14 stomach showing Car4 cells (red) atop p63 cells (green) and corresponding section stained with antibodies to Ki67 (red; lower left panel). Top right panel, Car4 cells (red) in direct contact with basement membrane in distal regions lacking p63 cells. Lower right panel, corresponding section stained with antibodies to Ki67 (red). D. Schematic depicting hypothetical undermining of Car4 cells (red) by proximal migration of p63 cells (green). E. Imaging of E14 proximal stomach epithelium in sections of p63 null embryo with antibodies to Car4 (green, left panel), Claudin 3 (red, middle panel) and Ki67 (red, right panel).
Figure 5
Figure 5
Persistence of embryonic cells at the squamocolumnar junction A. Distribution of the Krt7 (green)- and Krt5 (red)-expressing cells in wild type embryos from E13 to E19. While originally a columnar epithelium at E13 and E14, these cells assume a supra-squamous position at E15 and ultimately disintegrate as a suprasquamous cell layer at E18 except for the squamocolumnar junction where they persist in all six embryos tested. B. Histology section through the squamocolumnar junction of a wild type three-week-old mouse bordered by the proximal stomach (PS) and the distal stomach (DS). C. Heatmap of genes differentially expressed in the proximal stomach, the junction, and the distal stomach. D. Venn diagram of intersection between genes highly expressed in the junction versus the metaplasia of the p63 null mouse. E. Heatmaps of genes overexpressed in common between the metaplasia of the p63 null mouse (KO-proximal stomach vs WT-proximal stomach, the squamocolumnar junction of the wild type adult mouse (WT-junction vs WT proximal stomach), and Barrett's esophagus (BE vs normal human esophagus). See also Figure S5 and Table S4.
Figure 6
Figure 6
Residual embryonic cells in human tissues A. Immunofluorescence imaging of section of human 21-week-old esophagus showing suprasquamous distribution of Krt7 (green), Muc4 (green), and Krt5 (red). These results were consistent in the three independent fetuses tested. B. Expression of Krt7 (green), Krt5 (red), and Muc4 (green) cells in section of gastroesophageal junction from adult human without Barrett's esophagus. This result was consistent in the sections from three individuals tested.
Figure 7
Figure 7
Damage-induced activation of the residual primitive epithelium in adult mice A. left, Section through normal junction of adult mouse stained with anti-Krt14 antibodies to reveal squamous epithelia (red) and anti-Krt7 antibodies to detect residual embryonic cells (green). right, Junctional section stained with anti-p63 antibodies to reveal squamous basal cells (green) and anti-Krt6 antibodies to stain specialized junctional squamous cells (red). B. Schematic of the DTA-Krt14Cre mouse strain constructed to assess the effect of damaging the squamous epithelium on cells of the squamocolumnar junction following injections of Tamoxifen over one to three weeks. C. left, Micrograph depicting the apposition of Krt6-expressing squamous epithelium (red) and the Krt7-positive embryonic cells (green) at the squamocolumnar junction of a three-week-old mouse that has not received Tamoxifen injections. Right, Apparent migration of the Krt7-positive cells (green) to sites among and beneath the Krt6-positive squamous cells (red) at the junction following one week of Tamoxifen treatment. D. Schematic in which chronic acid-reflux damages squamous tissues and induces a hypothetical opportunistic migration of residual embryonic cells that normally reside at the junction. Krt6-expressing squamous cells are shown in red, the residual embryonic cells in green, and the gastric epithelium in green. See also Figure S6.

Comment in

References

    1. Antonioli DA, Wang HH. Morphology of Barrett's esophagus and Barrett's-associated dysplasia and adenocarcinoma. Gastroenterol. Clin. North Am. 1997;26:495–506. - PubMed
    1. Badreddine RJ, Wang KK. Barrett's esophagus: an update. Nat. Rev. Gastroent. Hepatolff. 2010;7:369–378. - PubMed
    1. Barr H, Shepherd NA, Dix A, Roberts DJ, Tan WC, Krasner N. Eradication of high-grade dysplasia in columnar-lined (Barrett's) oesophagus by photodynamic therapy with endogenously generated protoporphyrin IX. Lancet. 1996;348:584–585. - PubMed
    1. Bissell MJ, Radisky DC, Rizki A, Weaver VM, Petersen OW. The organizing principle: microenvironmental influences in the normal and malignant breast. Differentiation. 2002;70:537–546. - PMC - PubMed
    1. Blot WJ, Devesa SS, Kneller RW, Fraumeni JF., Jr. Rising incidence of adenocarcinoma of the esophagus and gastric cardia. J. Am. Med. Assoc. 1991;265:1287–1289. - PubMed

Publication types