. 2011 Aug;179(2):661-72.
doi: 10.1016/j.ajpath.2011.04.021. Epub 2011 May 31.

miR-21 and miR-214 are consistently modulated during renal injury in rodent models

Affiliations

miR-21 and miR-214 are consistently modulated during renal injury in rodent models

Laura Denby et al. Am J Pathol. 2011 Aug.

Abstract

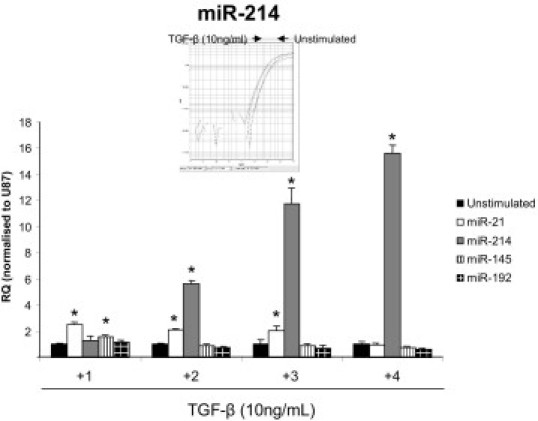
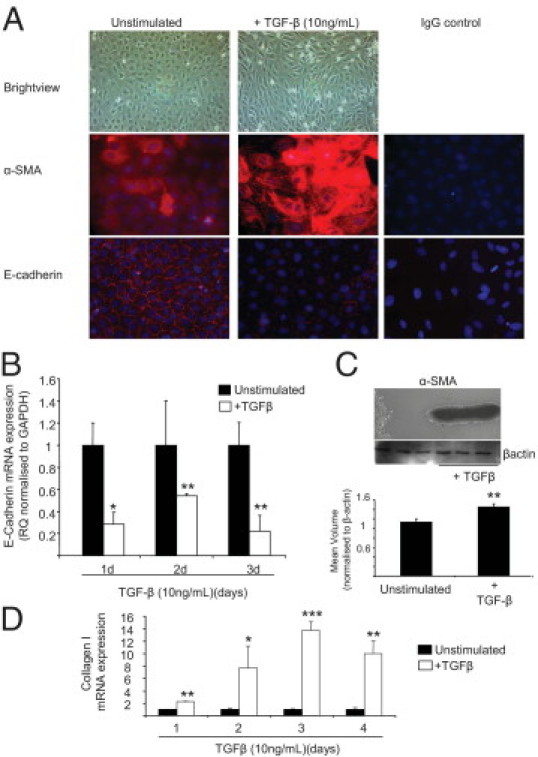
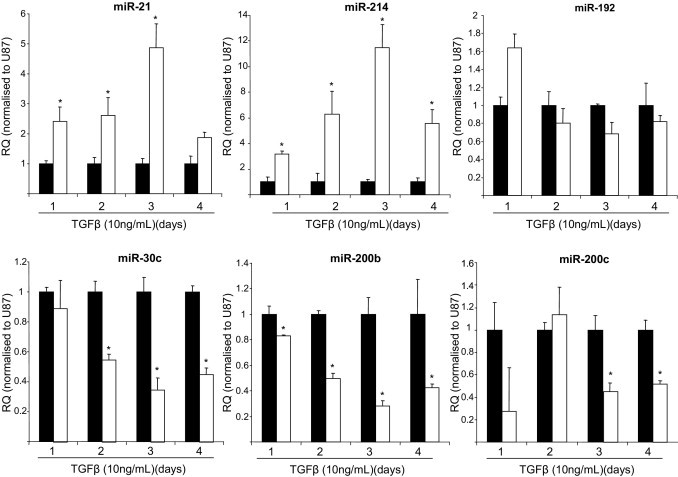
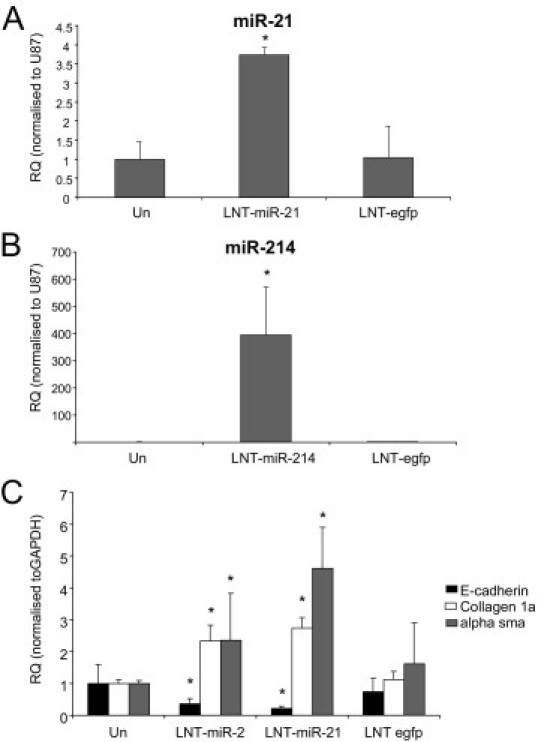
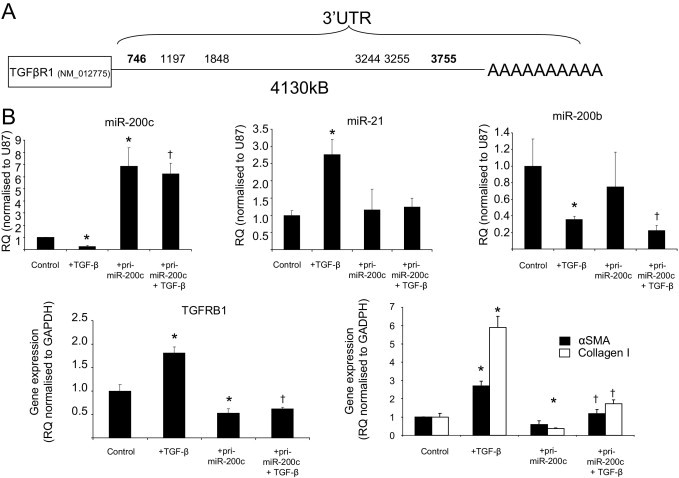
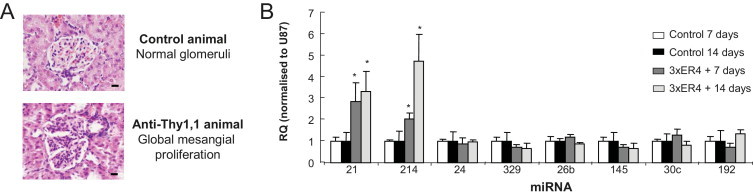
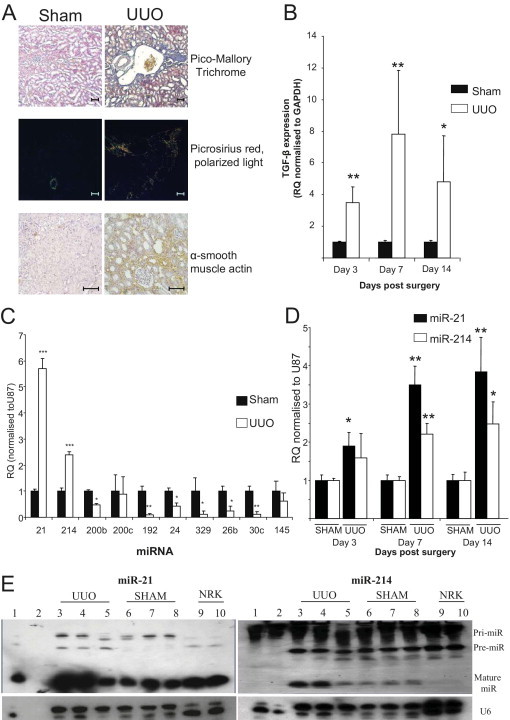
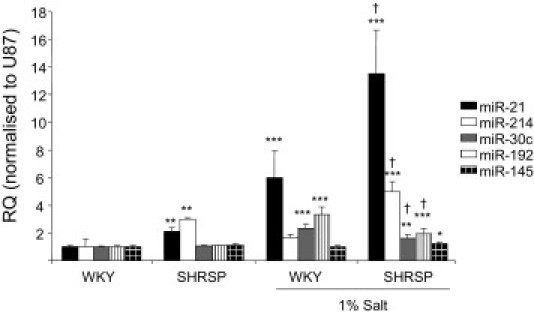
Transforming growth factor (TGF)-β is one of the main fibrogenic cytokines that drives the pathophysiology of progressive renal scarring. MicroRNAs (miRNAs) are endogenous non-coding RNAs that post-transcriptionally regulate gene expression. We examined the role of TGF-β-induced expression of miR-21, miRNAs in cell culture models and miRNA expression in relevant models of renal disease. In vitro, TGF-β changed expression of miR-21, miR-214, and miR-145 in rat mesangial cells (CRL-2753) and miR-214, miR-21, miR-30c, miR-200b, and miR-200c during induction of epithelial-mesenchymal transition in rat tubular epithelial cells (NRK52E). miR-214 expression was robustly modulated in both cell types, whereas in tubular epithelial cells miR-21 was increased and miR-200b and miR-200c were decreased by 58% and 48%, respectively, in response to TGF-β. TGF-β receptor-1 was found to be a target of miR-200b/c and was down-regulated after overexpression of miR-200c. To assess the differential expression of these miRNAs in vivo, we used the anti-Thy1.1 mesangial glomerulonephritis model and the unilateral ureteral obstruction model in which TGF-β plays a role and also a genetic model of hypertension, the stroke-prone spontaneously hypertensive rat with and without salt loading. The expressions of miR-214 and miR-21 were significantly increased in all in vivo models, showing a possible miRNA signature of renal damage despite differing causes.


Figures

Figure 1
Figure 1
Effect of TGF-β on microRNA expression in cultured rat mesangial cells. Rat mesangial cells (CRL-2573; RMCs) were stimulated with 10 ng/mL rTGF-β (R&D Systems) over a 4-day time course. RNA was harvested from the cells by miReasy kit (Qiagen), and miRNA expression was measured by specific miRNA Taqman probes (Applied Biosystems) and normalized to U87. RQ ± RQ max. *P < 0.05 versus unstimulated time-matched controls. Inset is a representative Taqman amplification curve from one unstimulated versus a TGF-β sample; N = 3.
Figure 2
Figure 2
TGF-β–induced EMT in cultured rat tubular epithelial cells. Rat tubular epithelial cells (NRK52E; NRK) were stimulated with 10 ng/mL rTGF-β (R&D Systems) over a 4-day time course. A: Immunocytochemistry for α-SMA and E-cadherin expression in unstimulated and TGF-β–stimulated cells (5 days); original magnification, ×40. B: E-cadherin gene expression. Total RNA was extracted with the miRNeasy kit (Qiagen), and E-cadherin expression was measured by specific rat Taqman probes (Applied Biosystems) and normalized to rat GAPDH. RQ ± RQ max. *P < 0.05 and **P < 0.01 versus unstimulated time-matched controls. C: α-SMA protein expression in cells undergoing EMT. Western blot analysis of cell lysates probed for α-SMA and β-actin as a loading control. Images underwent densitometry. Mean volume ± SD. **P < 0.01. D: Gene expression of collagen 1 in unstimulated and TGF-β–stimulated cells. RQ ± RQ max. *P < 0.05, **P < 0.01, and ***P < 0.001 compared with unstimulated time-matched control cells.
Figure 3
Figure 3
miRNA expression in tubular epithelial cells undergoing EMT. Rat tubular epithelial cells (NRK52E; NRK) were stimulated with 10 ng/mL rTGF-β (R&D Systems) over a 4-day time course. RNA was harvested from the cells by miReasy kit (Qiagen), and miRNA expression was measured by specific miRNA Taqman probes (Applied Biosystems) and normalized to U87. Each graph represents an individual miRNA. RQ ± RQ max. *P < 0.05 compared with unstimulated time-matched control cells.
Figure 4
Figure 4
Effect of miR-21 and miR-214 overexpression on rat tubular epithelial cells. NRK52E cells were infected with Lenti-(LNT) miR-21, LNT-miR-214, or LNT-egfp at a multiplicity of infection of 5 for 24 hours. Cells were then serum starved for 2 days and then cultured for 4 days in serum-free media. RNA was harvested from the cells by miReasy kit (Qiagen), and miRNA expression was measured by specific miRNA Taqman probes (Applied Biosystems) and normalized to U87. Gene expression was measured with the use of gene-specific probes (rat) and normalized to GAPDH. A: Expression of miR-21 by LNT-miR-21. RQ ± RQ max. B: Expression of miR-214 by LNT-miR-214. RQ ± RQ max. C: Modulation of EMT-associated genes by LNT-miR-21, LNT-miR-214, and LNT-egfp. RQ ± RQ max. Un, unifected. *P < 0.05 versus Un.
Figure 5
Figure 5
Effect of manipulation of miR-200c on TGFβ-R1 gene expression. A: Schematic diagram of 3′-UTR of rat TGFβR1 and miRNA seed sequence matches (nucleotide 2 to 7) for miR-200b/c. B: NRK52E cells were transfected with a plasmid containing cytomegalovirus promoter-driven pri-miR-200c by lipofectamine 2000 (2 μg of DNA:3 μl of lipofectamine), serum starved for 48 hours, and then stimulated with TGF-β. Total RNA was extracted with the miRNeasy kit (Qiagen), and miRNA expression was measured by specific miRNA Taqman probes (Applied Biosystems) and normalized to U87. TGF-βR1, α-SMA, and collagen I expressions were measured by specific rat gene expression probes (Applied Biosystems) and normalized to GAPDH (rat). RQ ± RQ max. *P < 0.05 versus control cells and P < 0.05 compared with control cells stimulated with TGF-β.
Figure 6
Figure 6
Validation of miRNA expression after induction of mesangial proliferative glomerulonephritis. Validation of miRNAs expressed in animals sacrificed 7 and 14 days after three ER4 injections 1 week apart compared with age-matched controls. A: Representative histology of normal glomeruli from control animals and the global mesangial proliferation observed in glomeruli in kidneys from animals that received three ER4 injections. B: miRNA expression measured by specific miRNA Taqman probes (Applied Biosystems) and normalized to U87. RQ ± RQ max. *P < 0.05 versus age-matched control animals (N = 4 to 6).
Figure 7
Figure 7
miRNA expression after UUO. A: Histologic analysis of kidneys from sham and UUO animals for tubulo-interstitial fibrosis by Pico-Mallory Trichrome and Picro Sirius red (viewed under cross-polarized light) and α-SMA staining 16 days after surgery. Scale bars: 100 μm. B: TGF-β gene expression in animals undergoing UUO. Total kidney RNA was extracted with the use of the miRNeasy kit (Qiagen), and TGF-β gene expression was measured by specific rat TGF-β gene expression probe (Applied Biosystems) and normalized to GAPDH (rat). RQ ± RQ max. *P < 0.05 and **P < 0.01. C: miRNA expression in kidneys of sham or UUO animals was measured by specific miRNA Taqman probes (Applied Biosystems) and normalized to U87. RQ ± RQ max. *P < 0.05, **P < 0.01, and ***P < 0.001 compared with sham animals (N = 5). D: miR-21 and miR-214 expression in UUO animals over time. Total RNA was extracted with the use of the miRNeasy kit (Qiagen), and miRNA expression was measured by specific miRNA Taqman probes (Applied Biosystems) and normalized to U87. RQ ± RQ max. *P < 0.05 and **P < 0.01 versus age-matched control sham-operated animals (N = 3). E: miR-21 and miR-214 expression in kidney tissue 7 days after surgery. Northern blot analyses were performed on total kidney RNA extracted with the use of the miRNeasy kit (Qiagen) of tissue from UUO and sham-operated animals at 7 days after surgery and probed with 5′-DIG–labeled LNA Mercury probes (Exiqon) rat miRNA for miR-21 and miR-214. U6 was used as a loading control (Exiquon). Lane 1 indicates HeLa cells; lane 2, RNA ladder; lanes 3 to 5, UUO RNA; lanes 6 to 8, SHAM RNA; and lanes 9 and 10, NRK52E (NRK) control RNA.
Figure 8
Figure 8
miRNA expression in genetic model of hypertension, the SHRSP. miRNA expression in kidneys of 21-week-old male WKY, SHRSP rats with and without salt loading (1%) was measured by specific miRNA Taqman probes (Applied Biosystems) and normalized to U87. RQ ± RQ max. *P < 0.05, **P < 0.01, and ***P < 0.001 compared with WKY expression levels; P < 0.05 compared with SHRSP expression levels.

References

    1. Bottinger E.P., Bitzer M. TGF-{beta} signaling in renal disease. J Am Soc Nephrol. 2002;13:2600–2610. - PubMed
    1. Liu Y. Renal fibrosis: new insights into the pathogenesis and therapeutics. Kidney Int. 2006;69:213–217. - PubMed
    1. Schlondorff D. The glomerular mesangial cell: an expanding role for a specialized pericyte. FASEB J. 1987;1:272–281. - PubMed
    1. Whelton P.K., Klag M.J. Hypertension as a risk factor for renal disease: Review of clinical and epidemiological evidence. Hypertension. 1989;13:I19–I27. - PubMed
    1. Koh-Tan H.H., Graham D., Hamilton C.A., Nicoll G., Fields L., McBride M.W., Young B., Dominiczak A.F. Renal and vascular glutathione S-transferase mu is not affected by pharmacological intervention to reduce systolic blood pressure. J Hypertens. 2009;27:1575–1584. - PubMed

Publication types

LinkOut - more resources