

Assessment of linear-scale indices for perimetry in terms of progression in early glaucoma
- PMID: 21704057
- PMCID: PMC3152648
- DOI: 10.1016/j.visres.2011.06.009
Assessment of linear-scale indices for perimetry in terms of progression in early glaucoma
Abstract
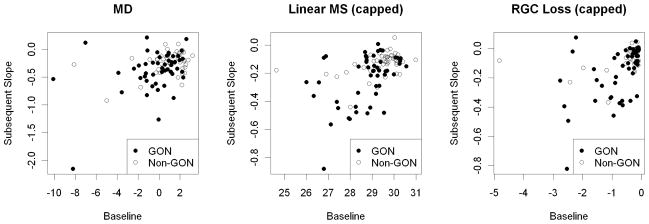
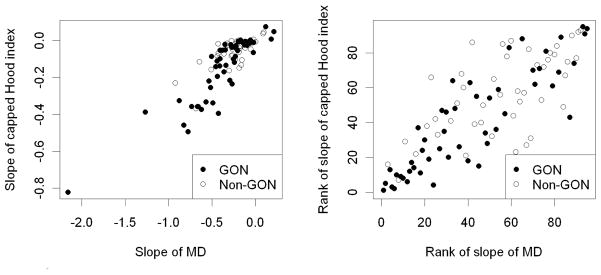
Currently, global indices that summarize the visual field combine sensitivities on a logarithmic (decibel) scale. Recent structure-function models for glaucoma suggest that contrast sensitivity should be converted to a linear scale before averaging across visual field locations, to better relate sensitivity with the number of surviving retinal ganglion cells (RGCs). New indices designed to represent the number of RGCs already lost are described. At least one was found to be a significantly better predictor of subsequent rate of change than traditional Mean Deviation (p=0.014) in participants with glaucomatous optic neuropathy. Issues concerning the creation of optimal global indices are discussed.
Copyright © 2011 Elsevier Ltd. All rights reserved.
Figures
Similar articles
-
Retinal sensitivity and retinal nerve fiber layer thickness measured by optical coherence tomography in glaucoma.Am J Ophthalmol. 2007 Nov;144(5):733-740. doi: 10.1016/j.ajo.2007.06.035. Epub 2007 Aug 20. Am J Ophthalmol. 2007. PMID: 17707327
-
A combined index of structure and function for staging glaucomatous damage.Arch Ophthalmol. 2012 May;130(5):E1-10. Arch Ophthalmol. 2012. PMID: 22826832
-
Correlating Structural and Functional Damage in Glaucoma.J Glaucoma. 2019 Dec;28(12):1079-1085. doi: 10.1097/IJG.0000000000001346. J Glaucoma. 2019. PMID: 31478953 Review.
-
Diffuse glaucomatous structural and functional damage in the hemifield without significant pattern loss.Arch Ophthalmol. 2009 Nov;127(11):1442-8. doi: 10.1001/archophthalmol.2009.196. Arch Ophthalmol. 2009. PMID: 19901209
-
The Evolving Role of the Relationship between Optic Nerve Structure and Function in Glaucoma.Ophthalmology. 2017 Dec;124(12S):S66-S70. doi: 10.1016/j.ophtha.2017.05.006. Ophthalmology. 2017. PMID: 29157364 Review.
Cited by
-
Retinal Vessel Pulsatile Characteristics Associated With Vascular Stiffness Can Predict the Rate of Functional Progression in Glaucoma Suspects.Invest Ophthalmol Vis Sci. 2023 Jun 1;64(7):30. doi: 10.1167/iovs.64.7.30. Invest Ophthalmol Vis Sci. 2023. PMID: 37335567 Free PMC article.
-
Evaluation of the Structure-Function Relationship in Glaucoma Using a Novel Method for Estimating the Number of Retinal Ganglion Cells in the Human Retina.Invest Ophthalmol Vis Sci. 2015 Aug;56(9):5548-56. doi: 10.1167/iovs.14-16366. Invest Ophthalmol Vis Sci. 2015. PMID: 26305526 Free PMC article.
-
Improved estimates of visual field progression using bayesian linear regression to integrate structural information in patients with ocular hypertension.Invest Ophthalmol Vis Sci. 2012 May 14;53(6):2760-9. doi: 10.1167/iovs.11-7976. Invest Ophthalmol Vis Sci. 2012. PMID: 22467579 Free PMC article.
-
Short-Term Changes in the Photopic Negative Response Following Intraocular Pressure Lowering in Glaucoma.Invest Ophthalmol Vis Sci. 2020 Aug 3;61(10):16. doi: 10.1167/iovs.61.10.16. Invest Ophthalmol Vis Sci. 2020. PMID: 32766747 Free PMC article.
-
Assessing assumptions of a combined structure-function index.Ophthalmic Physiol Opt. 2015 Mar;35(2):186-93. doi: 10.1111/opo.12195. Epub 2015 Jan 21. Ophthalmic Physiol Opt. 2015. PMID: 25604956 Free PMC article.
References
-
- Anderson D, Patella V. Automated Static Perimetry. St. Louis, MO: Mosby; 1999. pp. 147–159.
-
- Anderson R. The psychophysics of glaucoma: improving the structure/function relationship. Prog Retin Eye Res. 2006;25(1):79–97. - PubMed
-
- Artes PH, Nicolela MT, LeBlanc RP, Chauhan BC. Visual Field Progression in Glaucoma: Total Versus Pattern Deviation Analyses. Invest Ophthalmol Vis Sci. 2005;46(12):4600–4606. - PubMed
-
- Artes PH, O’Leary N, Hutchison D, Heckler L, Sharpe G, Nicolela MT, Chauhan BC. Properties of the Statpac Visual Field Index (in press) Invest Ophthalmol Vis Sci 2011 - PubMed
Publication types
MeSH terms
Grants and funding
LinkOut - more resources
Full Text Sources
Medical
