Review
. 2011 Oct;107(1):21-31.
doi: 10.1016/j.pbiomolbio.2011.06.004. Epub 2011 Jun 23.

Multi-scale modeling in biology: how to bridge the gaps between scales?

Affiliations
Review

Multi-scale modeling in biology: how to bridge the gaps between scales?

Zhilin Qu et al. Prog Biophys Mol Biol. 2011 Oct.

Abstract

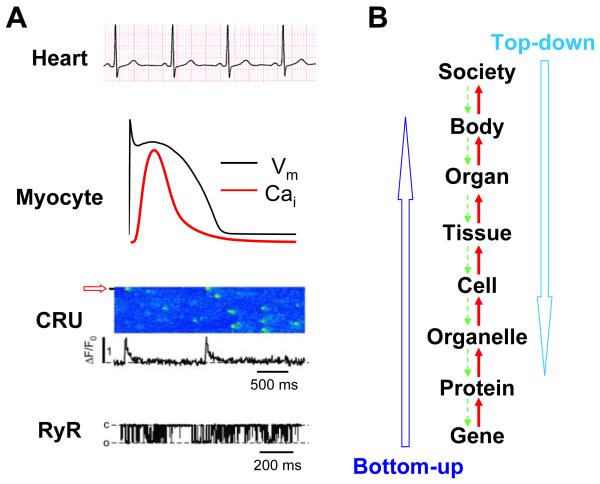
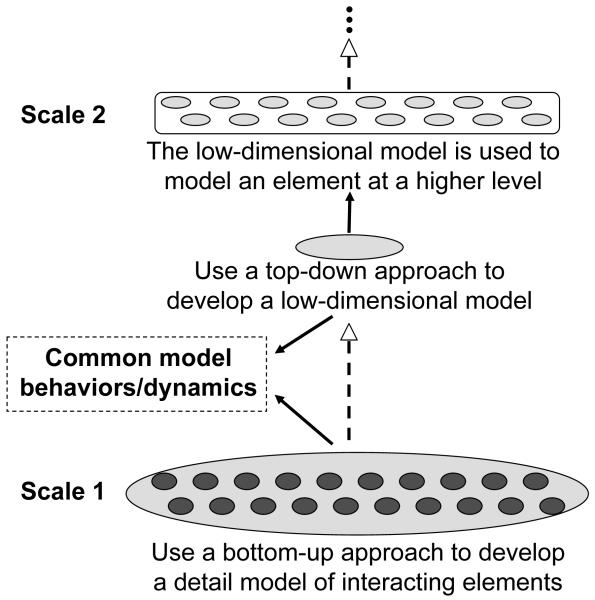
Human physiological functions are regulated across many orders of magnitude in space and time. Integrating the information and dynamics from one scale to another is critical for the understanding of human physiology and the treatment of diseases. Multi-scale modeling, as a computational approach, has been widely adopted by researchers in computational and systems biology. A key unsolved issue is how to represent appropriately the dynamical behaviors of a high-dimensional model of a lower scale by a low-dimensional model of a higher scale, so that it can be used to investigate complex dynamical behaviors at even higher scales of integration. In the article, we first review the widely-used different modeling methodologies and their applications at different scales. We then discuss the gaps between different modeling methodologies and between scales, and discuss potential methods for bridging the gaps between scales.


Figures

Figure 1
Figure 1. Multi-scale regulation in biology
A. An example of multi-scale regulation in cardiac excitation. RyR: A recording of a single RyR opening and closing (Zima et al., 2008). CRU: Ca sparks in a cardiac myocyte shown as a line-scan (time-space plot) (Zima et al., 2008). Red arrow indicates the location where the Ca transient (below) was recorded. Myocyte: An action potential (black) and the companion whole-cell Ca transient (red). Heart: A normal ECG. B. A schematic plot of different scales and their interactions in biology.
Figure 2
Figure 2. Multi-scale modeling
See text for detailed description.
Figure 3
Figure 3. Stochastic simulation
A. A simple reaction scheme in which Y changes to X with a reaction rate constant α and changes back with rate β. B. Upper trace: A stochastic simulation of the model in A using the Gillespie algorithm, showing random switching between Y and X. α=β=1 was used in the simulation. Middle trace: The ratio between the number (nx) of the X molecule and the total molecules (N) versus time when N=50. Bottom trace: nx/N versus time when N=500. For this simple model, as N increases, nx/N approaches the steady state of the deterministic equation (Eq.2): α/(α+β)=0.5, with smaller and smaller fluctuations. C. A schematic plot of the transitions from different states of the X molecule in an N-molecule system.
Figure 4
Figure 4. An agent-based model of a Ca spark
A. A 3-state model of a CRU. Recovered—the CRU is recovered available to spark; Excited—the CRU fires; Recovering—the CRU is in the recovery period. The transitions between these states are random. B. Schematic plot of Ca spark showing the latency period after a stimulus applied at t=0, the spark duration and strength, and the recovery period.
Figure 5
Figure 5. Keizer’s paradox
Black line: the concentration of the X molecule versus time obtained by solving the differential equation. Gray line: the number (nx) of the X molecule from a stochastic simulation of the model using the Gillespie algorithm.
Figure 6
Figure 6. Noise-induced phase transition
A. Steady state of the deterministic model (Eq.8). B. Steady state of probability distributions of the stochastic model (Eq.9) when λ=0 with weak noise (dashed) and strong noise (solid).
Figure 7
Figure 7. Illustrative plots of sub-cellular waves
A. A wave occurring at one end of a cell propagates to the other end. B. A wave occurring at the center of a cell propagating to both ends. C. Multiple waves occurring at different locations and time. D. A spiral wave.
Figure 8
Figure 8. APD alternans and complex dynamics due to APD restitution
A. A voltage trace showing the relationship between DI, APD, and PCL. B. An APD restitution curve (APDn+1 versus DIn). C. A bifurcation diagram by plotting APD versus PCL obtained by iterating Eqs.10 and 11 with the APD restitution curve shown in B. For each PCL, the first 100 APDs were dropped and the next 100 APDs were plotted. When the equilibrium point is stable for a PCL, the 100 APDs are the same so that only one point on the plot for that PCL. When alternans (or chaos) occurs, two (or many) APD points show up for that PCL. The bifurcation sequence is: 1:1 → 2:2 → 2:1 → 4:2 → ID → 4:1 → 8:2 → ID. ID stands for irregular dynamics. D. Bifurcation diagram from an experiment of a sheep cardiac Purkinje fiber (Chialvo et al., 1990). The bifurcation sequence is: 1:1 → 2:2 → 2:1 → 4:2 → 3:1 → 6:2 → 4:1 → 8:2 → ID. The notion m:n indicates that every m stimuli result in n different action potentials, e.g., 4:2 indicates that every 4 stimuli give rise to 2 different action potentials, which is APD alternans. Basic cycle length is the same as PCL.

References

    1. Achuthan S, Canavier CC. Phase-resetting curves determine synchronization, phase locking, and clustering in networks of neural oscillators. J Neurosci. 2009;29:5218–33. - PMC - PubMed
    1. Aon MA, Cortassa S, O’Rourke B. Percolation and criticality in a mitochondrial network. Proc Natl Acad Sci U S A. 2004;101:4447–52. - PMC - PubMed
    1. Baker RE, Simpson MJ. Correcting mean-field approximations for birth-death-movement processes. Phys Rev E. 2010;82:041905. - PubMed
    1. Bankes SC. Agent-based modeling: a revolution? Proc Natl Acad Sci U S A. 2002;99(Suppl 3):7199–200. - PMC - PubMed
    1. Bassingthwaighte JB, Chizeck HJ, Atlas LE, Qian H. Multiscale modeling of cardiac cellular energetics. Ann N Y Acad Sci. 2005;1047:395–424. - PMC - PubMed

Publication types

LinkOut - more resources