

Peat bog wildfire smoke exposure in rural North Carolina is associated with cardiopulmonary emergency department visits assessed through syndromic surveillance
- PMID: 21705297
- PMCID: PMC3230437
- DOI: 10.1289/ehp.1003206
Peat bog wildfire smoke exposure in rural North Carolina is associated with cardiopulmonary emergency department visits assessed through syndromic surveillance
Abstract
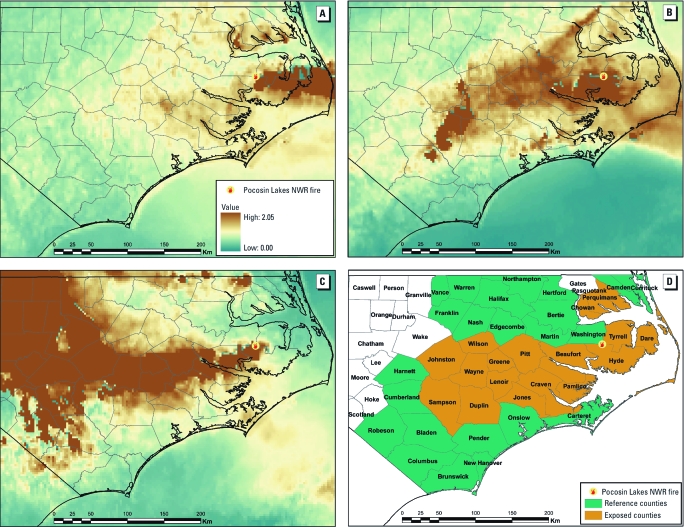
Background: In June 2008, burning peat deposits produced haze and air pollution far in excess of National Ambient Air Quality Standards, encroaching on rural communities of eastern North Carolina. Although the association of mortality and morbidity with exposure to urban air pollution is well established, the health effects associated with exposure to wildfire emissions are less well understood.
Objective: We investigated the effects of exposure on cardiorespiratory outcomes in the population affected by the fire.
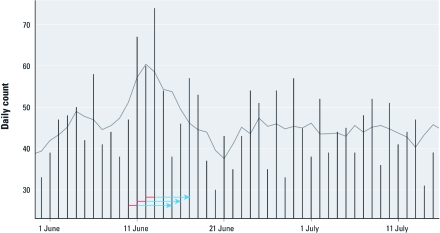
Methods: We performed a population-based study using emergency department (ED) visits reported through the syndromic surveillance program NC DETECT (North Carolina Disease Event Tracking and Epidemiologic Collection Tool). We used aerosol optical depth measured by a satellite to determine a high-exposure window and distinguish counties most impacted by the dense smoke plume from surrounding referent counties. Poisson log-linear regression with a 5-day distributed lag was used to estimate changes in the cumulative relative risk (RR).
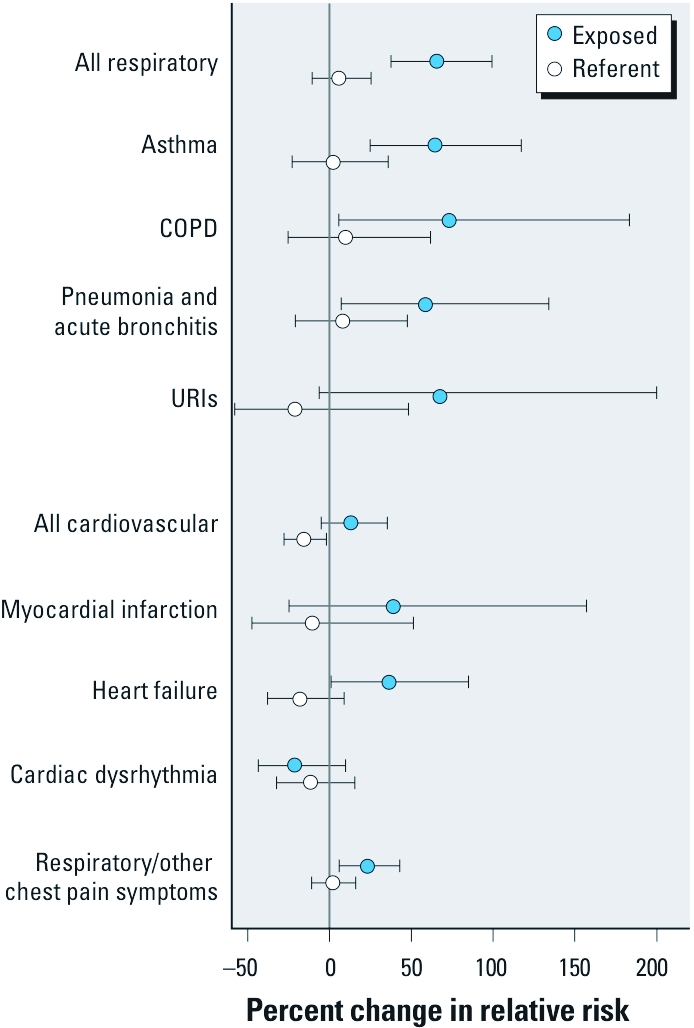
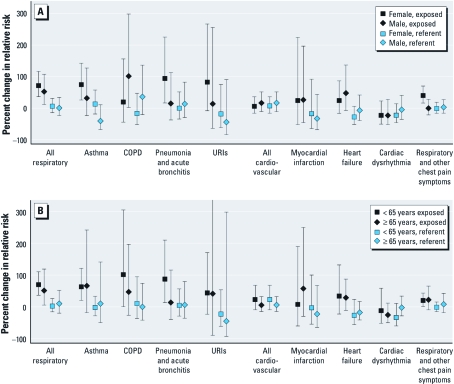
Results: In the exposed counties, significant increases in cumulative RR for asthma [1.65 (95% confidence interval, 1.25-2.1)], chronic obstructive pulmonary disease [1.73 (1.06-2.83)], and pneumonia and acute bronchitis [1.59 (1.07-2.34)] were observed. ED visits associated with cardiopulmonary symptoms [1.23 (1.06-1.43)] and heart failure [1.37 (1.01-1.85)] were also significantly increased.
Conclusions: Satellite data and syndromic surveillance were combined to assess the health impacts of wildfire smoke in rural counties with sparse air-quality monitoring. This is the first study to demonstrate both respiratory and cardiac effects after brief exposure to peat wildfire smoke.
Conflict of interest statement
The research described in this article has been reviewed by the National Health and Environmental Effects Research Laboratory, U.S. EPA, and approved for publication. Approval does not signify that the contents necessarily reflect the views and the policies of the agency, nor does mention of trade names or commercial products constitute endorsement or recommendation for use. The N.C. Public Health Data Group and NC DETECT (North Carolina Disease Event Tracking and Epidemiologic Collection Tool) are not responsible for the scientific validity or accuracy of methodology, results, statistical analyses, or conclusions presented.
The authors declare they have no actual or potential competing financial interests.
Figures
References
-
- Al-Saadi J, Szykman J, Pierce RB, Kittaka C, Neil D, Chu DA, et al. Improving national air quality forecasts with satellite aerosol observations. Bull Am Meteorol Soc. 2005;86(9):1249–1261.
-
- Braga AL, Zanobetti A, Schwartz J. The lag structure between particulate air pollution and respiratory and cardiovascular deaths in 10 US cities. J Occup Environ Med. 2001;43(11):927–933. - PubMed
-
- Brook RD, Rajagopalan S, Pope CA, III, Brook JR, Bhatnagar A, Diez-Roux AV, et al. Particulate matter air pollution and cardiovascular disease: an update to the scientific statement from the American Heart Association. Circulation. 2010;121(21):2331–2378. - PubMed
-
- Buehler JW, Sonricker A, Paladin M, Soper P, Mostashari F. Syndromic Surveillance Practice in the United States: Findings from a Survey of State, Territorial, and Selected Local Health Departments. Adv Dis Surveill 6(3):1–20. 2008. Available: http://www.syndromic.org/ADS/prepub/Buehler20080503.pdf [accessed 22 August 2011]
Publication types
MeSH terms
Substances
LinkOut - more resources
Full Text Sources
Other Literature Sources
Medical
Molecular Biology Databases
