. 2011 Aug 19;286(33):28963-28977.
doi: 10.1074/jbc.M111.256289. Epub 2011 Jun 24.

Studies on human DNA polymerase epsilon and GINS complex and their role in DNA replication

Affiliations

Studies on human DNA polymerase epsilon and GINS complex and their role in DNA replication

Vladimir P Bermudez et al. J Biol Chem. .

Abstract

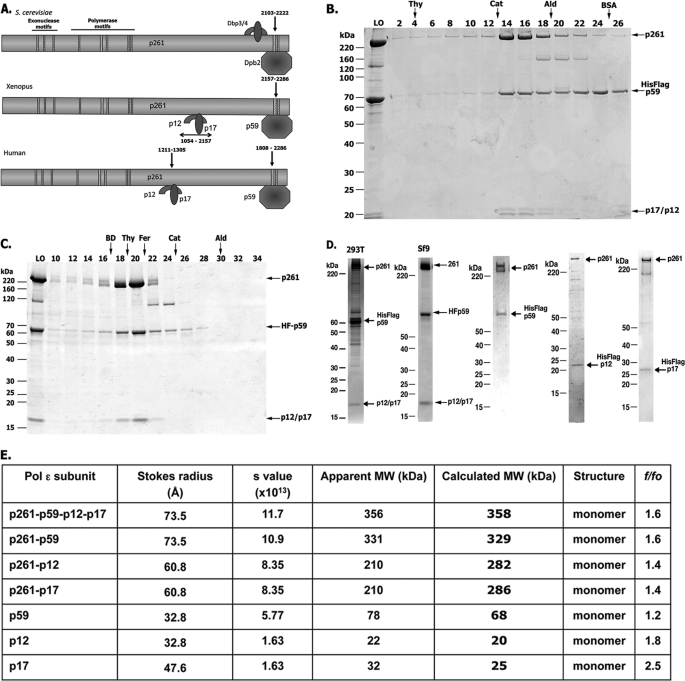
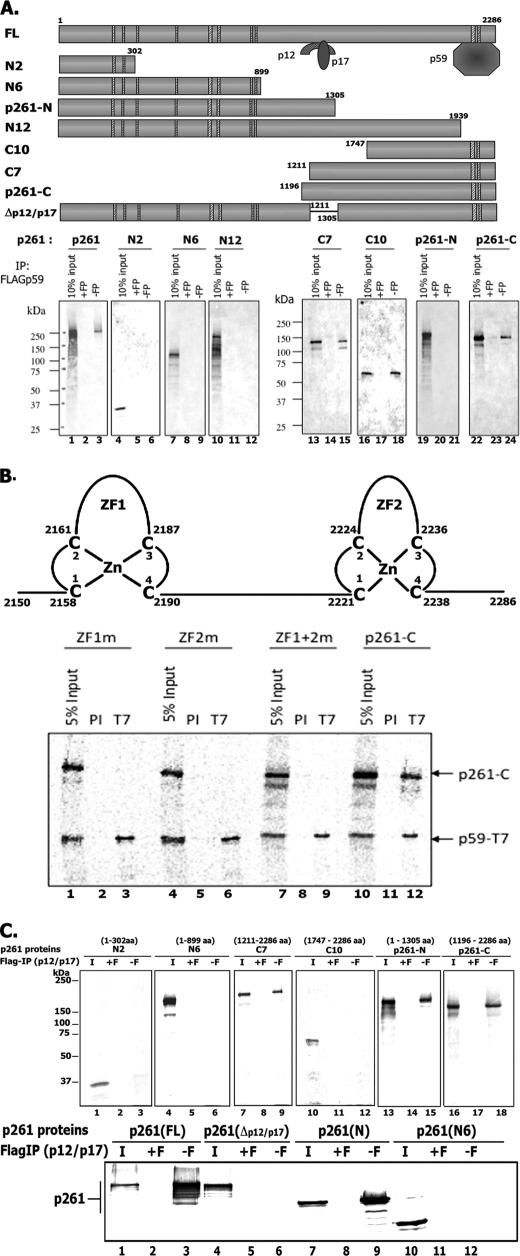
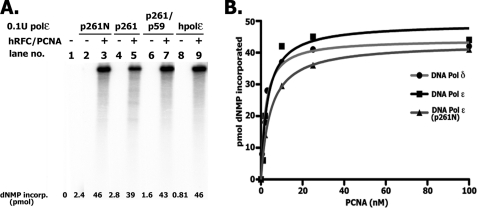
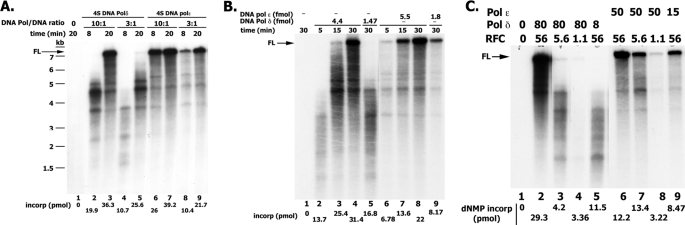
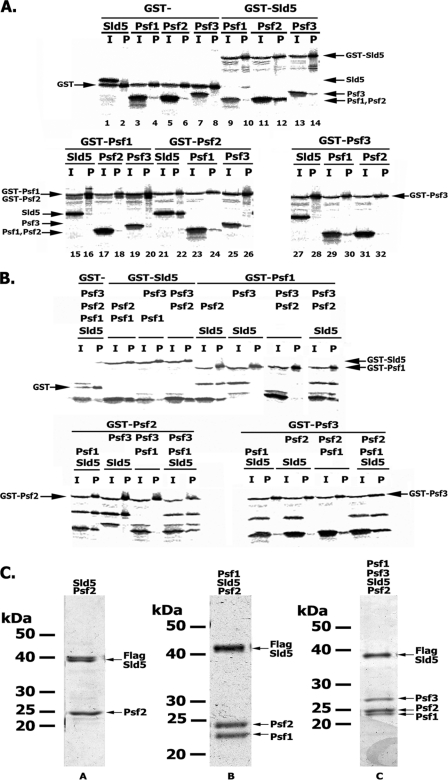
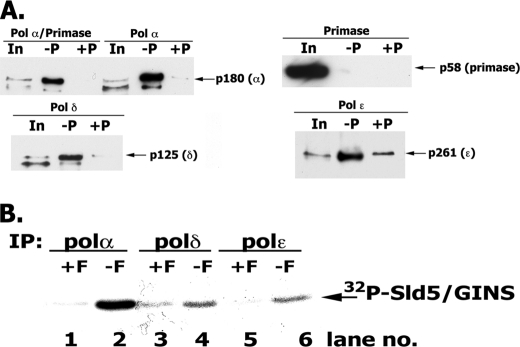
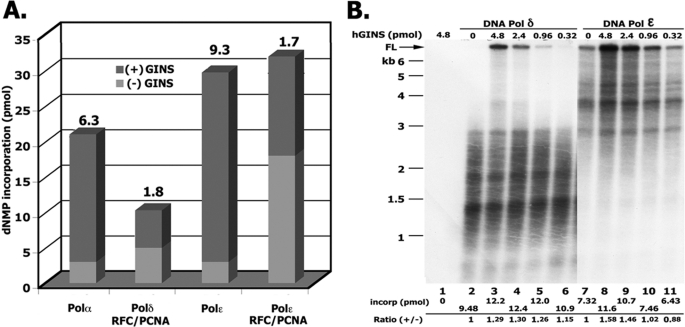
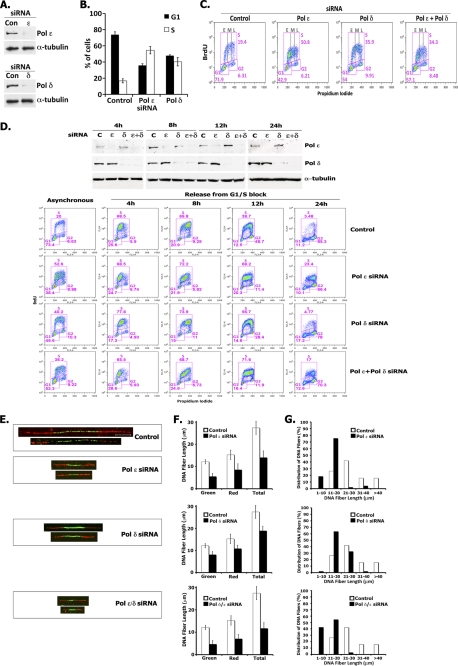
In eukaryotic cells, DNA replication is carried out by the coordinated action of three DNA polymerases (Pols), Pol α, δ, and ε. In this report, we describe the reconstitution of the human four-subunit Pol ε and characterization of its catalytic properties in comparison with Pol α and Pol δ. Human Pol ε holoenzyme is a monomeric complex containing stoichiometric subunit levels of p261/Pol 2, p59, p17, and p12. We show that the Pol ε p261 N-terminal catalytic domain is solely responsible for its ability to catalyze DNA synthesis. Importantly, human Pol (hPol) ε was found more processive than hPol δ in supporting proliferating cell nuclear antigen-dependent elongation of DNA chains, which is in keeping with proposed roles for hPol ε and hPol δ in the replication of leading and lagging strands, respectively. Furthermore, GINS, a component of the replicative helicase complex that is composed of Sld5, Psf1, Psf2, and Psf3, was shown to interact weakly with all three replicative DNA Pols (α, δ, and ε) and to markedly stimulate the activities of Pol α and Pol ε. In vivo studies indicated that siRNA-targeted depletion of hPol δ and/or hPol ε reduced cell cycle progression and the rate of fork progression. Under the conditions used, we noted that depletion of Pol ε had a more pronounced inhibitory effect on cellular DNA replication than depletion of Pol δ. We suggest that reduction in the level of Pol δ may be less deleterious because of its collision-and-release role in lagging strand synthesis.


Figures

FIGURE 1.
FIGURE 1.
Structure and purification of hPol ϵ. A, comparison of the motifs present in the large catalytic subunit and the interaction sites of the small subunits (yeast, Xenopus, and human). The hatched rectangles indicate the conserved exonuclease and polymerase motifs located at the N-terminal half of the catalytic subunit. B, glycerol gradient sedimentation of the four-subunit hPol ϵ. FLAG-immunoprecipitated hPol ϵ (270 μg) was sedimented through 5-ml 15–35% glycerol gradients for 18 h at 250,000 × g at 4 °C. Collected fractions were subjected to 4–20% polyacrylamide gradient-SDS gel electrophoresis and Coomassie staining. LO, material loaded onto the gradient (2 μg of protein). The size markers are indicated. C, elution profile of FLAG-purified hPol ϵ following Superose 6 chromatography. hPol ϵ (270 μg) was applied to a Superose 6 10/300 GL column equilibrated with 25 mm HEPES-NaOH, pH 7.5, 10% glycerol, 0.15 m NaCl, 1 mm DTT, 1 mm EDTA, 0.05% Nonidet P-40, and protease inhibitors. The column was developed with this buffer at a rate of 250 μl/min at 4 °C, and fractions (0.5 ml) were collected. Aliquots (10 μl) were subjected to 4–20% polyacrylamide gradient-SDS gel and Coomassie staining. D, SDS-PAGE analysis of four-subunit hPol ϵ and various subcomplexes. hPol ϵ, purified as described under “Experimental Procedures,” was subjected to 4–20% polyacrylamide gradient-SDS gel electrophoresis followed by Coomassie staining. The purified proteins and amount of protein analyzed were as follows: FLAG-p59·p261·p17·p12 (3 μg, isolated from 293T cells stably expressing FLAG-p59) (lane 1), FLAG-p59·p261·p17·p12 (2 μg) (lane 2), FLAG-p59·p261 (1.75 μg) (lane 3), FLAG-p12·p261 (0.5 μg) (lane 4), and FLAG-p17·p261 (0.5 μg) (lane 5). The positions of various hPol ϵ subunits are indicated. E, complexes, subcomplexes, and subunits indicated were subjected to glycerol gradient sedimentation (to evaluate their s values) and Superose 6 (or Superdex 200) gel filtration (to obtain their Stokes radii) (Å). Their apparent molecular weight was estimated according to Siegel and Monty (27).
FIGURE 2.
FIGURE 2.
Mapping of the p59 interaction site on p261. A, schematic diagram of truncated human Pol 2 mutant constructs used to map the p59 interaction site on the p261 subunit. Truncated p261 derivatives used in this study were N2 (aa 1–302), N6 (aa 1–899), p261-N (aa 1–1305), N12 (aa 1–1939), C10 (aa 1747–2286), C7 (aa 1211–2286), and p261-C (aa 1196–2286). All derivatives were expressed using IVTT reactions carried out in the presence of 1 μg of purified FLAG-tagged p59 and 35S-labeled methionine. After incubation, FLAG-p59 was immunoprecipitated (IP) with FLAG antibody coupled to agarose beads that were washed three times with FLAG buffer (25 mm Tris-HCl, pH 7.5, 10% glycerol, 5 mm EDTA, 1 mm DTT, 0.15 m NaCl, and 0.2% Nonidet P-40). Radiolabeled p261 derivatives bound by FLAG-tagged p59 were eluted in SDS sample loading buffer and subjected to 10% SDS-PAGE followed by autoradiography. The FLAG immunoprecipitations were carried out either in the presence (+F) or absence (−F) of 1 mg/ml FLAG peptide. B, diagram of the two conserved zinc finger motifs present at the C terminus of p261 (top). p261-C containing the double cysteine to alanine mutations in either of the zinc finger motifs ZF1m (C2158A/C2161A) or ZF2m (C2221A/C2224A) and the four cysteine mutations (ZF1m + ZF2m), were co-expressed with T7-tagged p59 in IVTT reactions followed by T7 immunoprecipitation, SDS-PAGE, and autoradiography. The p261-C subunit contained the wild-type zinc finger motifs. PI lanes, immunoprecipitations were carried out with control IgG; T7 lanes, immunoprecipitations were carried out with T7-specific antibody. C, mapping of the p12-p17 interaction site on the p261 subunit. Wild-type and truncated p261 derivatives were expressed in IVTT reactions in the presence of 1 mg of purified FLAG-p12·p17 complex. The p261 bound by FLAG-p12·p17 was FLAG-immunoprecipitated as described in A.
FIGURE 3.
FIGURE 3.
Influence of hPCNA and hRFC on various hPol ϵ preparations. A, influence of PCNA. Reaction mixtures (10 μl) contained 20 mm Tris-HCl, pH 7.5, 0.2 mm DTT, 200 μg/μl BSA, 10 mm magnesium acetate, 35 μm [α-32P]dATP (18,280 cpm/pmol), 2 mm ATP, 130 μm each of dCTP, dGTP, and dTTP, 0.2 m sodium glutamate, 1 nm singly primed M13, 350 nm E. coli SSB, 10 nm p261-N, 10.3 nm p261-FL, 11.2 nm p261 p59 complex or 11 nm four-subunit hPol ϵ (where indicated), 6 nm hRFC, and 100 nm PCNA. Mixtures were incubated for 30 min at 37 °C, and aliquots were used to measure nucleotide incorporation and size of DNA products following 1% alkaline-agarose gel separation and autoradiography. B, influence of PCNA levels on DNA synthesis using singly primed M13 DNA catalyzed by hPol δ, hPol ϵ, and p261-N. Reaction mixtures were as described in A (except that the level of glutamate was reduced to 30 mm) with the indicated levels of PCNA and either the four-subunit Pol ϵ, p261-N, or hPol δ preparation.
FIGURE 4.
FIGURE 4.
Rate of chain elongation reaction catalyzed by Pol δ and Pol ϵ. A, influence of the ratio of Pol ϵ to DNA on length of DNA products formed. Reaction mixtures (10 μl) containing 20 mm Tris-HCl, pH 7.5, 150 μg/ml BSA, 10 mm magnesium acetate, 1 mm DTT, 0.1 mm EDTA, 30 mm potassium glutamate, 1.5 mm ATP, 30 μm [α-32P]dATP (23,230 cpm/pmol), 130 μm each of dCTP, dTTP, and dGTP, 0.73 nm singly primed M13, 70 nm E. coli SSB, 5.6 nm RFC, 50 nm PCNA, and either 7.3 or 2.19 nm hPol δ or the four-subunit hPol ϵ (as indicated) were incubated at 37 °C for the time specified. Reactions were halted with EDTA (10 mm final), and aliquots were removed to determine the level of nucleotide incorporation and size of DNA products following alkaline-agarose electrophoresis. B, influence of Pol/DNA ratio following preincubation of RFC/PCNA with DNA. Reactions were as described in A and contained 1 nm singly primed M13 DNA and the indicated levels of hPol δ and hPol ϵ. Reaction mixtures lacking Pols were preincubated for 3 min at 37 °C to preload RFC and PCNA onto DNA, after which the Pols were added. Mixtures were then incubated for the time indicated at 37 °C. C, influence of RFC levels on the rate and size of DNA synthesized with hPol ϵ and hPol δ. Reaction mixtures, as described in A, with the indicated levels of RFC and hPols, were incubated for 20 min at 37 °C.
FIGURE 5.
FIGURE 5.
Assembly of the four-subunit hGINS complex. A and B, two- and three-subunit interactions. Various subunit combinations of the hGINS complex with one subunit tagged with GST were expressed using the IVTT system followed by GST pull-down. The material bound to the beads was eluted with SDS loading buffer and subjected to 12% SDS-PAGE, and the 35S-labeled proteins were detected by autoradiography. The proteins expressed in each reaction are indicated above the lanes. I, 10% input; P, GST pull-down step. C, in vivo formation and isolation of GINS complexes. Four-subunit hGINS and subcomplexes were isolated from Sf9-infected cells as described under “Experimental Procedures” and subjected to 12% SDS-PAGE followed by Coomassie staining. The specific complexes loaded in each lane are indicated above each lane; the amount of protein loaded was as follows: His-FLAG-Sld5·Psf2 (0.3 μg), His-FLAG-Sld5·Psf2·Psf1 (0.7 μg), and His-FLAG-Sld5·Psf2·Psf1·Psf3 (0.5 μg).
FIGURE 6.
FIGURE 6.
Interaction of hGINS with replication Pols. A, interaction of GINS and Pols detected following infection of High Five insect cells. High Five insect cells were infected with viruses expressing the indicated FLAG-tagged Pols and the four GINS subunits (including GST-Sld5). After infection, cells were lysed, and the GST-GINS (and associated proteins) was pulled-down with glutathione-agarose beads as described under “Experimental Procedures.” GST-precipitated material was subjected to 4–20% polyacrylamide gradient gel/SDS electrophoresis and Western blotting, and bands were visualized with Pol-specific antibodies. In, 1% of input; −P, GST pull-down carried out without Precission protease treatment; +P, GST pull-downs carried out following Precission protease treatment. B, in vitro interaction of GINS and Pols. Reaction mixtures (100 μl) containing 3 pmol of FLAG-tagged Pol α-primase complex (or Pol δ or Pol ϵ) and 5 pmol of 32P-labeled GINS (1454 cpm/fmol) were incubated in Binding Buffer (50 mm HEPES, pH 7.5, 0.05% Nonidet P-40, 100 mm NaCl, 0.1 mg/ml BSA, and protease inhibitors) for 16 h at 4 °C. After incubation, reaction mixtures were divided into two equal aliquots, 15 μl of FLAG-agarose beads were added to both, and FLAG peptide (final concentration, 1 mg/ml) was added to one aliquot (+F) that served as a negative control. Pols were immunoprecipitated (IP) with FLAG antibody for 2 h at 4 °C, and the beads were washed three times with 0.5 ml of Binding Buffer. The bound proteins were eluted by boiling the beads in 15 μl of 1× SDS loading buffer, and the proteins were resolved in 12% SDS-PAGE; GINS was detected by autoradiography and phosphorimaging.
FIGURE 7.
FIGURE 7.
Influence of hGINS on replicative Pols. A, reactions with an oligonucleotide primer-template. Reaction mixtures (20 μl) contained 40 μm HEPES-NaOH buffer, pH 7.5, 100 μg/ml BSA, 0.75 mm DTT, 10 mm magnesium acetate, 17.5 μm [α-32P]dATP (9157 cpm/pmol), 75 μm dCTP, 125 μm oligonucleotide primer-template 90-mer (TG)20 as template (26), 50 mm NaCl, and, where specified, a 0.3 nm concentration of the two-subunit (p180-p70) Pol α complex, 4 nm four-subunit Pol ϵ, 9 nm Pol δ, 5.6 nm RFC, 50 nm PCNA, and 1 mm ATP. After 30 min at 37 °C, aliquots were removed to measure DNA synthesis. B, stimulation of Pol δ and Pol ϵ holoenzyme activity by GINS using singly primed M13. Reaction mixtures (10 μl) contained 20 mm Tris-HCl, pH 7.5, 150 μg/ml BSA, 1 mm DTT, 10 mm magnesium acetate, 2 mm ATP, 20 μm [α-32P]dATP (17,750 cpm/pmol), 120 μm each of dCTP, dGTP, and dTTP, 30 mm sodium glutamate, 1 nm singly primed M13, 400 nm E. coli SSB, 5.6 nm RFC, 50 nm PCNA, and varying levels of the four-subunit hGINS complex. Mixtures were incubated for 3 min at 37 °C and then supplemented with 2.2 nm Pol δ or 2.2 nm Pol ϵ, as indicated. Following incubation for 10 min at 37 °C, aliquots were removed to measure DNA synthesis and the size of labeled DNA products formed.
FIGURE 8.
FIGURE 8.
Depletion of hPol ϵ or hPol δ slows down S phase progression. A, siRNA depletion of Pol δ or Pol ϵ. HeLa cells were transfected with control (Con) siRNA or specific siRNAs targeting Pol ϵ or Pol δ (siRNAs used for depletion of Pol ϵ and Pol δ were #08 and #06, respectively; supplemental Fig. 5). The levels of the large subunits of Pol ϵ and Pol δ were measured by immunoblotting 48 h after transfection. To quantitate the extent of depletion of Pol ϵ and Pol δ, the protein levels were adjusted using the α-tubulin loading control and quantified relative to the protein level present in the control sample. B and C, siRNA depletion of Pol δ or Pol ϵ leads to accumulation of cells in S phase. HeLa cells were transfected with control siRNA or with siRNAs targeting either Pol ϵ or Pol δ. After 48 h, cells were incubated with BrdU for 90 min, stained with BrdU-FITC antibody and propidium iodide (PI), and analyzed by flow cytometry. The bar graph (B) shows the percentage of S phase (BrdU-positive) cells versus G1 phase cells present in each sample. Plots (C) show BrdU incorporation (y axis), DNA content (x axis), and cell cycle distribution (described for B) of HeLa cells following siRNA treatment. The distribution of cells present in early (E), middle (M), and late (L) S phase is also indicated. D, Pol ϵ-depleted cells progress more slowly through S phase. HeLa cells were transfected with control siRNA, Pol ϵ siRNA, Pol δ siRNA, or a combination of these siRNAs 4 h before synchronization by double thymidine block. Arrested cells were released into nocodazole-containing medium, harvested at the times indicated following BrdU treatment for 90 min, and analyzed for protein depletion by immunoblotting (top panel) and by flow cytometry (lower panels) as described in A. The BrdU plots show the profiles of samples treated with the indicated Pol ϵ/Pol δ siRNAs compared with control siRNA samples at the indicated cell cycle stage: asynchronous cells, 4 h (early-middle S), 8 h (late S), 12 h (G2), and 24 h (mitosis). E–G, replication fork progression analyses. HeLa cells transfected with Pol ϵ or Pol δ siRNA alone and with both siRNAs were incubated for 20 min with IdU followed by 20 min with CldU and then subjected to replication fork movement analysis. Individual replicating forks were visualized by immunofluorescence of the incorporated halogenated nucleotides present in isolated DNA fibers, as described under “Experimental Procedures.” E, images of fibers. The bar in the fiber image of the control sample corresponds to 10 μm. The mean DNA fiber length was calculated by measuring at least 100 individual fibers in each experiment, and the results were plotted (F). The data from one representative experiment are plotted as percentage of DNA fibers possessing the specified length indicated (G). Error bars, S.E.

References

    1. Johansson E., Macneill S. A. (2010) Trends Biochem. Sci. 35, 339–347 - PubMed
    1. Pursell Z. F., Isoz I., Lundström E. B., Johansson E., Kunkel T. A. (2007) Science 317, 127–130 - PMC - PubMed
    1. Nick McElhinny S. A., Gordenin D. A., Stith C. M., Burgers P. M., Kunkel T. A. (2008) Mol. Cell 30, 137–144 - PMC - PubMed
    1. Fukui T., Yamauchi K., Muroya T., Akiyama M., Maki H., Sugino A., Waga S. (2004) Genes Cells 9, 179–191 - PubMed
    1. Waga S., Masuda T., Takisawa H., Sugino A. (2001) Proc. Natl. Acad. Sci. U.S.A. 98, 4978–4983 - PMC - PubMed