. 2012 Jan;29(1):61-9.
doi: 10.1093/molbev/msr111. Epub 2011 Jun 24.

On the origins of Mendelian disease genes in man: the impact of gene duplication

Affiliations

On the origins of Mendelian disease genes in man: the impact of gene duplication

Jonathan E Dickerson et al. Mol Biol Evol. 2012 Jan.

Erratum in

  • Mol Biol Evol. 2012 Sep;29(9):2284

Abstract

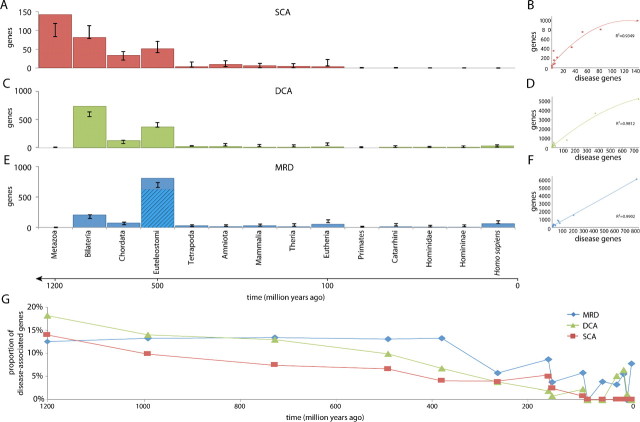
Over 3,000 human diseases are known to be linked to heritable genetic variation, mapping to over 1,700 unique genes. Dating of the evolutionary age of these disease-associated genes has suggested that they have a tendency to be ancient, specifically coming into existence with early metazoa. The approach taken by past studies, however, assumes that the age of a disease is the same as the age of its common ancestor, ignoring the fundamental contribution of duplication events in the evolution of new genes and function. Here, we date both the common ancestor and the duplication history of known human disease-associated genes. We find that the majority of disease genes (80%) are genes that have been duplicated in their evolutionary history. Periods for which there are more disease-associated genes, for example, at the origins of bony vertebrates, are explained by the emergence of more genes at that time, and the majority of these are duplicates inferred to have arisen by whole-genome duplication. These relationships are similar for different disease types and the disease-associated gene's cellular function. This indicates that the emergence of duplication-associated diseases has been ongoing and approximately constant (relative to the retention of duplicate genes) throughout the evolution of life. This continued until approximately 390 Ma from which time relatively fewer novel genes came into existence on the human lineage, let alone disease genes. For single-copy genes associated with disease, we find that the numbers of disease genes decreases with recency. For the majority of duplicates, the disease-associated mutation is associated with just one of the duplicate copies. A universal explanation for heritable disease is, thus, that it is merely a by-product of the evolutionary process; the evolution of new genes (de novo or by duplication) results in the potential for new diseases to emerge.


Figures

F<sc>IG</sc> 1.
FIG 1.
The association of disease-associated genes with evolutionary history. Distribution of disease-associated genes for (A) SCA, (C) DCA, and (E) MRD over time. The proportion of duplicates attributed to whole-genome duplication (Makino and McLysaght 2010) are shown (hashed lines) for Euteleostomi only, as these proportions were ≤ 5% for other periods (Supplementary fig. S3, Supplementary Material online). Null distribution: random genes were selected for the distributions of MRD, DCA, and SCA genes, maintaining counts, from their respective nondisease–associated gene lists; this was repeated 10,000 times and the upper and lower quantiles (2.5% and 97.5%, respectively) of these distributions are shown as error bars. Taxonomic levels are indicated on the x axis of panel E and approximate evolutionary time below this. The proportions of disease-associated genes versus nondisease–associated genes for each taxonomic level are also shown for SCA (B), DCA (D), and MRD (F); polynomial regression trend lines (degree = 2) are shown in each case: SCA: R2 = 0.93, F statistic = 78.97, P = value 3.0×10 − 7; DCA: R2 = 0.98, F = 287.5, P = value 3.2×10 − 10; and MRD: R2 = 0.99, F = 558, P = value 8.8×10 − 12. (G) Ratios of the proportions of disease-associated SCA (red), DCA (green), and MRD (blue) among all SCA, DCA, and MRD, respectively, in each taxonomic level over approximate evolutionary time.
F<sc>IG</sc> 2.
FIG 2.
The evolution of disease types. Disease class frequencies for disease-associated genes for (A) orthologs and (B) paralogs for each taxonomic level. Disease classes correspond to high-level categories.
F<sc>IG</sc> 3.
FIG 3.
Effect of positive selection on disease-associated genes. Mean dN/dS between Homo sapiens and Pan troglodytes for disease-associated (green triangles) and nondisease–associated (blue circles) orthologs (A) and paralogs (B) in each taxonomic level. Category axis labels corresponds to each taxonomic level. Inset bar chart displays percentage of both disease-associated and nondisease–associated genes in each taxonomic level.
F<sc>IG</sc> 4.
FIG 4.
(A) Frequencies of disease genes associated with different sizes of gene families and (B) frequencies of unique diseases associated with the same genes for SCA and MRD. The proportion of duplicates attributed to whole-genome duplication (Makino and McLysaght 2010) are shown for panel A (hashed lines).

References

    1. Altshuler D, Daly MJ, Lander ES. Genetic mapping in human disease. Science. 2008;322:881–888. - PMC - PubMed
    1. Benton MJ, Ayala FJ. Dating the tree of life. Science. 2003;300:1698–1700. - PubMed
    1. Benton MJ, Donoghue PCJ. Paleontological evidence to date the tree of life. Mol Biol Evol. 2007;24:26–53. - PubMed
    1. Blomme T, Vandepoele K, De Bodt S, Simillion C, Maere S, Van de Peer Y. The gain and loss of genes during 600 million years of vertebrate evolution. Genome Biol. 2006;7:R43. - PMC - PubMed
    1. Cai J, Borenstein E, Chen R, Petrov D. Similarly strong purifying selection acts on human disease genes of all evolutionary ages. Genome Biol Evol. 2009;1:131. - PMC - PubMed

Publication types

LinkOut - more resources