. 2011 Aug;21(8):1249-59.
doi: 10.1101/gr.120162.110. Epub 2011 Jun 24.

High-throughput mapping of the promoters of the mouse olfactory receptor genes reveals a new type of mammalian promoter and provides insight into olfactory receptor gene regulation

Affiliations

High-throughput mapping of the promoters of the mouse olfactory receptor genes reveals a new type of mammalian promoter and provides insight into olfactory receptor gene regulation

E Josephine Clowney et al. Genome Res. 2011 Aug.

Abstract

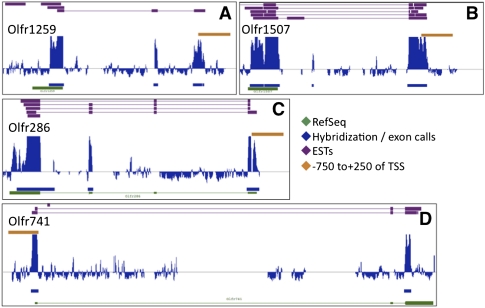
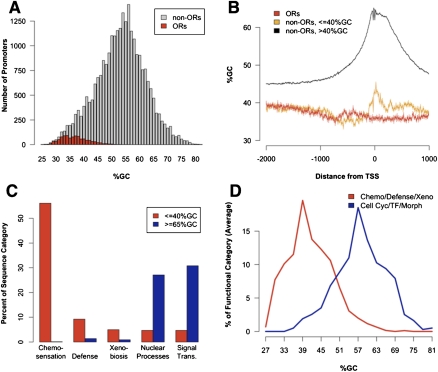
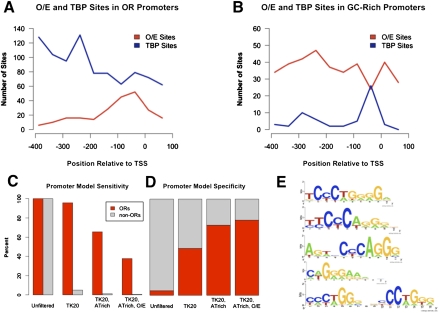
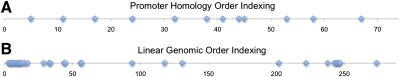
The olfactory receptor (OR) genes are the largest mammalian gene family and are expressed in a monogenic and monoallelic fashion in olfactory neurons. Using a high-throughput approach, we mapped the transcription start sites of 1085 of the 1400 murine OR genes and performed computational analysis that revealed potential transcription factor binding sites shared by the majority of these promoters. Our analysis produced a hierarchical model for OR promoter recognition in which unusually high AT content, a unique epigenetic signature, and a stereotypically positioned O/E site distinguish OR promoters from the rest of the murine promoters. Our computations revealed an intriguing correlation between promoter AT content and evolutionary plasticity, as the most AT-rich promoters regulate rapidly evolving gene families. Within the AT-rich promoter category the position of the TATA-box does not correlate with the transcription start site. Instead, a spike in GC composition might define the exact location of the TSS, introducing the concept of "genomic contrast" in transcriptional regulation. Finally, our experiments show that genomic neighborhood rather than promoter sequence correlates with the probability of different OR genes to be expressed in the same olfactory cell.


Figures

Figure 1.
Figure 1.
One thousand eighty-five olfactory receptor 5′ structures mapped by high-throughput RLM-RACE. For selected ORs (AD), RefSeq records (green), ESTs (purple), summary hybridization patterns and computed exons (blue), and promoter calls (orange) are displayed in IGB. Our hybridization patterns match RefSeq and EST records well. As shown for Olfr286, the tiling array cannot detect exons that occur in RepeatMasked (and therefore untiled) areas of the genome or across probes that do not map uniquely. For scale, the orange bar is 1000 bp in each panel.
Figure 2.
Figure 2.
Promoters of ORs and other plastic gene families are extremely AT-rich. (A) Olfactory receptor TSS's were mapped, and the %GC distribution of OR (red) and non-OR (gray) promoters (−750 bp to +250 bp relative to TSS) was compared. (B) %GC around the TSS was plotted for ORs (red) and non-ORs sorted by average GC content (orange, black). (C) Promoters ≤40% GC (red) or ≥65% GC (blue) were categorized by gene function (skewing of each category into AT or GC significant, p < 10−10, χ2) (see Methods). (D) Full GC content distribution of averaged biased functional groups (for statistics, see Supplemental Fig. S2; Supplemental Table 1).
Figure 3.
Figure 3.
O/E sites define the OR TSS. (A) OR promoters (n = 1085 for O/E, 243 for TBP) and (B) GC-rich promoters (≥65% GC in −750 to +250 region; n = 1098) were searched for O/E and TBP sites using strings. (O/E) TCCCTGGGG, up to one mismatch; (TBP) TATAWW. Sites were plotted by position relative to TSS. (C,D) Murine promoters were filtered by H4K20-Me3 (“TK20”) coverage of at least 50% of the gene body, then by AT content of at least 60%, and then by presence of summary O/E site (TCCC or CCCT string) within 100 bp upstream of the TSS. Of 501 murine promoters meeting the filters, 383 drive ORs (specificity: 78%; sensitivity: 38%). The numbers of genes passing each filter and statistical significance can be found in Supplemental Table S3. (E) Gibbs Recursive Sampler and MEME identify new O/E sites in OR promoters.
Figure 4.
Figure 4.
ORs on chromosome 2 expressed in olfactory placode cells are similar in genomic locus but not in promoter sequence. ORs on chromosome 2 were indexed by (A) promoter sequence homology order (determined by the bottom level of the Hopach fuzzy clustering tree of pairwise distance measures generated by the wordcount method outlined in Figure S3) or (B) linear order along the chromosome. Index numbers of ORs expressed in undifferentiated OP27 cells were graphed, although expression patterns in the other three conditions were similar. After RepeatMasking, only 74 chromosome 2 promoters were long enough to be analyzed. The linear index contains 288 ORs.

References

    1. Affolter M, Slattery M, Mann RS 2008. A lexicon for homeodomain–DNA recognition. Cell 133: 1133–1135 - PubMed
    1. Affymetrix 2005-2007. Tiling array tools. http://www.affymetrix.com/partners_programs/programs/developer/TilingArr...
    1. Akan P, Deloukas P 2008. DNA sequence and structural properties as predictors of human and mouse promoters. Gene 410: 165–176 - PMC - PubMed
    1. Ashburner M, Ball CA, Blake JA, Botstein D, Butler H, Cherry JM, Davis AP, Dolinski K, Dwight SS, Eppig JT, et al. 2000. Gene Ontology: tool for the unification of biology. The Gene Ontology Consortium. Nat Genet 25: 25–29 - PMC - PubMed
    1. Bailey TL, Elkan C 1994. Fitting a mixture model by expectation maximization to discover motifs in biopolymers. Proceedings of the Second International Conference on Intelligent Systems for Molecular Biology, pp. 28–36 AAAI Press, Menlo Park, CA - PubMed

Publication types