. 2011 Aug;156(4):1679-90.
doi: 10.1104/pp.111.174748. Epub 2011 Jun 24.

B73-Mo17 near-isogenic lines demonstrate dispersed structural variation in maize

Affiliations

B73-Mo17 near-isogenic lines demonstrate dispersed structural variation in maize

Steven R Eichten et al. Plant Physiol. 2011 Aug.

Abstract

Recombinant inbred lines developed from the maize (Zea mays ssp. mays) inbreds B73 and Mo17 have been widely used to discover quantitative trait loci controlling a wide variety of phenotypic traits and as a resource to produce high-resolution genetic maps. These two parents were used to produce a set of near-isogenic lines (NILs) with small regions of introgression into both backgrounds. A novel array-based genotyping platform was used to score genotypes of over 7,000 loci in 100 NILs with B73 as the recurrent parent and 50 NILs with Mo17 as the recurrent parent. This population contains introgressions that cover the majority of the maize genome. The set of NILs displayed an excess of residual heterozygosity relative to the amount expected based on their pedigrees, and this excess residual heterozygosity is enriched in the low-recombination regions near the centromeres. The genotyping platform provided the ability to survey copy number variants that exist in more copies in Mo17 than in B73. The majority of these Mo17-specific duplications are located in unlinked positions throughout the genome. The utility of this population for the discovery and validation of quantitative trait loci was assessed through analysis of plant height variation.


Figures

Figure 1.
Figure 1.
Hybridization log2 ratio values provide lower overall signal for Mo17-like sequence compared with B73, allowing regions of introgression to be mapped. A to D, All 10 maize chromosomes. Blue and red markers indicate B73-like and Mo17-like calls, respectively. Black lines indicate segment lengths and average log2 ratio values developed from DNAcopy. The resulting mapped segments are shown within (black boxes). A and C show all 62,995 array probes that develop a higher hybridization signal from B73 compared with Mo17. B and D contain probes averaged by their corresponding BAC and provide more robust log2 ratio averages and clearer visualization. E to H, Detailed views of regions showing the resolution differences using a probe or an averaged BAC approach. Window sizes are indicated.
Figure 2.
Figure 2.
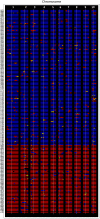
Genotype mapped across 7,438 BACs that include at least three probes. One hundred B73-like and 50 Mo17-like NILs are compared on a genetic map across all 10 maize chromosomes. Blue, red, and yellow regions correspond to B73-like, Mo17-like, and heterozygous regions, respectively. White lines indicate centromere positions.
Figure 3.
Figure 3.
Percentage of introgression per BAC within the B73-like (blue) or Mo17-like (red) NIL population by physical (A) or genetic (B) position. For every BAC, a count of how many lines contain an introgression at that location was developed. This count was divided by the total number of NIL lines within the class (B73 like or Mo17 like).
Figure 4.
Figure 4.
Significant enrichment of heterozygosity within centromere regions was observed across NIL samples. The percentage of residual heterozygosity expected (based on the number of backcrosses and self-pollinations) is compared with the level of heterozygosity observed for the whole genome, the regions within 10 cM of the centromere, and the chromosome arms. The residual heterozygosity is significantly higher (P < 0.05) than the expected level for the whole genome as well as the chromosome arms.
Figure 5.
Figure 5.
A, Schematic illustration of potential chromosomal constitutions for Mo17-like or B73-like NILs containing a tandem (1) or dispersed (2) duplicate in Mo17. The expected CGH signals are shown to the right for each of the possible configurations. B, Several examples of the linked and unlinked duplications are shown. For each probe, the NILs were divided into four groups based on the NIL type (B73 like or Mo17 like) and the genotype at the probe locus (B73 or Mo17). The log2(NIL/B73) ratios for each line are plotted. The linked duplications exhibit signal that is based upon the genotype at the probe locus, while the unlinked duplications exhibit signal that is determined by the NIL type.

References

    1. Auger DL, Gray AD, Ream TS, Kato A, Coe EH, Jr, Birchler JA. (2005) Nonadditive gene expression in diploid and triploid hybrids of maize. Genetics 169: 389–397 - PMC - PubMed
    1. Baird NA, Etter PD, Atwood TS, Currey MC, Shiver AL, Lewis ZA, Selker EU, Cresko WA, Johnson EA. (2008) Rapid SNP discovery and genetic mapping using sequenced RAD markers. PLoS ONE 3: e3376. - PMC - PubMed
    1. Balint-Kurti PJ, Wisser R, Zwonitzer JC. (2008) Use of an advanced intercross line population for precise mapping of quantitative trait loci for gray leaf spot resistance in maize. Crop Sci 48: 1696–1704
    1. Balint-Kurti PJ, Yang J, Van Esbroeck G, Jung J, Smith ME. (2010) Use of a maize advanced intercross line for mapping of QTL for northern leaf blight resistance and multiple disease resistance. Crop Sci 50: 458–466
    1. Balint-Kurti PJ, Zwonitzer JC, Wisser RJ, Carson ML, Oropeza-Rosas MA, Holland JB, Szalma SJ. (2007) Precise mapping of quantitative trait loci for resistance to southern leaf blight, caused by Cochliobolus heterostrophus race O, and flowering time using advanced intercross maize lines. Genetics 176: 645–657 - PMC - PubMed

Publication types

LinkOut - more resources