. 2011 Sep;189(1):237-49.
doi: 10.1534/genetics.111.130922. Epub 2011 Jul 29.

Quantification of inbreeding due to distant ancestors and its detection using dense single nucleotide polymorphism data

Affiliations

Quantification of inbreeding due to distant ancestors and its detection using dense single nucleotide polymorphism data

Matthew C Keller et al. Genetics. 2011 Sep.

Erratum in

  • Genetics. 2012 Jan;190(1):283

Abstract

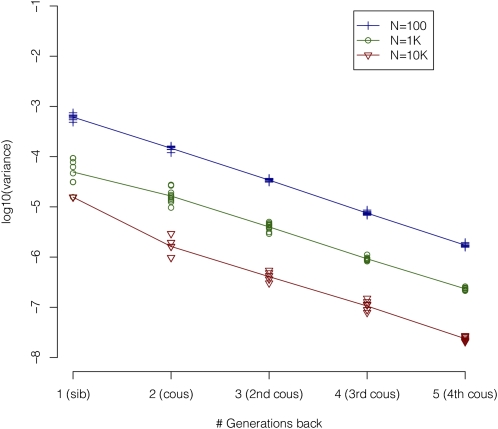
Inbreeding depression, which refers to reduced fitness among offspring of related parents, has traditionally been studied using pedigrees. In practice, pedigree information is difficult to obtain, potentially unreliable, and rarely assessed for inbreeding arising from common ancestors who lived more than a few generations ago. Recently, there has been excitement about using SNP data to estimate inbreeding (F) arising from distant common ancestors in apparently "outbred" populations. Statistical power to detect inbreeding depression using SNP data depends on the actual variation in inbreeding in a population, the accuracy of detecting that with marker data, the effect size, and the sample size. No one has yet investigated what variation in F is expected in SNP data as a function of population size, and it is unclear which estimate of F is optimal for detecting inbreeding depression. In the present study, we use theory, simulated genetic data, and real genetic data to find the optimal estimate of F, to quantify the likely variation in F in populations of various sizes, and to estimate the power to detect inbreeding depression. We find that F estimated from runs of homozygosity (Froh), which reflects shared ancestry of genetic haplotypes, retains variation in even large populations (e.g., SD=0.5% when Ne=10,000) and is likely to be the most powerful method of detecting inbreeding effects from among several alternative estimates of F. However, large samples (e.g., 12,000-65,000) will be required to detect inbreeding depression for likely effect sizes, and so studies using Froh to date have probably been underpowered.


Figures

Figure 1
Figure 1
Procedure for deriving 10 samples from each of three effective population sizes. Circles represent populations, arrows represent evolution and splitting/combining of each population, and squares represent samples of size 1000 derived from each population. The sizes of the shapes correspond to population (circles and arrows) or to sample (squares) sizes. See text for details.
Figure 2
Figure 2
Shown is the probability that mates share no common ancestors in the most recent g generations as a function of population size (see text). The x’s are the same values, derived empirically from simulations, for up to 5 generations in the past, and show good agreement with the expected probabilities. Even in large, randomly breeding populations (e.g., 1 million), it is almost certain that at least one ancestor exists in common between two pedigrees within 11 generations.
Figure 3
Figure 3
Contribution to var(Fped) from previous generations. Most of the variance in Fped at all population sizes is attributable to recent inbreeding. For example, the variance in Fped due to spouses sharing common ancestors five generations in the past makes up only ∼0.2% of the total variance in Fped at all population sizes.
Figure 4
Figure 4
Variance of F (±1 SE) as a function of Ne. The variance of Fped is the lowest at all population sizes and the variance of Froh is intermediate. Comparing the variance of genomic measures of F in simulated data to the equivalent variances in real SNP data (from an outbred Caucasian sample) suggests that the effective population size of Caucasians is ∼10,000 with respect to these statistics.
Figure 5
Figure 5
Prediction error variance (PEV) of genomic estimates of F as a function of Ne. PEV decreases as a function of population size for all genomic estimates of F, but does so most rapidly for Froh.
Figure 6
Figure 6
Correlations between Fped and genomic estimates of F as a function of Ne. All correlations between genomic estimates of F and Fped decrease as a function of Ne, but Froh is consistently correlated most highly with Fped.
Figure 7
Figure 7
Correlations between F and homozygous mutation load as a function of Ne. Froh correlates most highly with the homozygous mutation load at all population sizes, and this advantage increases at larger population sizes (where inbreeding becomes more ancient).
Figure 8
Figure 8
Correlations between alternative thresholds of Froh and the homozygous mutation load as a function of Ne. Runs of homozygosity (ROHs) are defined as stretches of 0.5-Mb, 1.5-Mb, or 5-Mb homozygous SNPs. Long thresholds are optimal for detecting autozygosity in highly inbred populations, whereas shorter thresholds are optimal for detecting autozygosity in outbred populations.
Figure 9
Figure 9
Variance of F (±1 SE) as a function of generations since population expansion. Whereas Fped drops immediately following a population expansion, the variance in genomic measures of F requires hundreds of generations to reach equilibrium levels.
Figure 10
Figure 10
Correlations between F and homozygous mutation load as a function of generations since population expansion. The relationship between the homozygous mutation load and Froh increases the most quickly following a population expansion.
Figure 11
Figure 11
Estimated power to detect inbreeding effects on a human complex trait using Froh. Higher levels of real inbreeding (smaller Ne) lead to higher variance in Froh and thus greater statistical power to detect an inbreeding effect. Large (solid lines) and small (dashed lines) inbreeding effect sizes were derived from a review on the effects of consanguinity on IQ (see text). Arrows show predicted sample sizes required to achieve ∼80% power. When inbreeding is high (Ne = 100), sample sizes of ∼400 are adequate, but in outbred populations (Ne = 10,000 or real SNP data), samples sizes >20,000 may be required.

References

    1. Abaskuliev A. A., Skoblo G. V., 1975. Inbreeding, endogamy and exogamy among relatives of schizophrenia patients. Genetika 11: 145–148 - PubMed
    1. Afzal M., 1988. Consequences of consanguinity on cognitive behavior. Behav. Genet. 18: 583–594 - PubMed
    1. Bittles A. H., Black M. L., 2010a Evolution in health and medicine Sackler colloquium: consanguinity, human evolution, and complex diseases. Proc. Natl. Acad. Sci. USA 107(Suppl. 1): 1779–1786 - PMC - PubMed
    1. Bittles A. H., Black M. L., 2010. b The impact of consanguinity on neonatal and infant health. Early Hum. Dev. 86: 1779–1786 - PubMed
    1. Brown D. E., 1991. Human Universals. McGraw-Hill, New York

Publication types