

Metabolic effects of albumin therapy in acute lung injury measured by proton nuclear magnetic resonance spectroscopy of plasma: a pilot study
- PMID: 21705902
- PMCID: PMC3930451
- DOI: 10.1097/CCM.0b013e31822571ce
Metabolic effects of albumin therapy in acute lung injury measured by proton nuclear magnetic resonance spectroscopy of plasma: a pilot study
Abstract
Objective: Improved means to monitor and guide interventions could be useful in the intensive care unit. Metabolomic analysis with bioinformatics is used to understand mechanisms and identify biomarkers of disease development and progression. This pilot study evaluated plasma proton nuclear magnetic resonance spectroscopy as a means to monitor metabolism following albumin administration in acute lung injury patients.
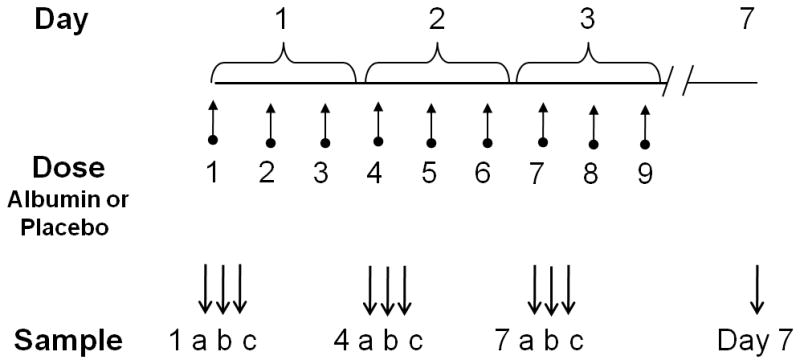
Design: This study was conducted on plasma samples from six albumin-treated and six saline-treated patients from a larger double-blind trial. The albumin group was administered 25 g of 25% human albumin in 0.9% saline every 8 hrs for a total of nine doses over 72 hrs. A 0.9% concentration of saline was used as a placebo. Blood samples were collected immediately before, 1 hr after, and 4 hrs after the albumin/saline administration for the first, fourth, and seventh doses (first dose of each day for 3 days). Samples were analyzed by proton nuclear magnetic resonance spectroscopy, and spectra were analyzed by principal component analysis and biostatistical methods.
Interventions: None.
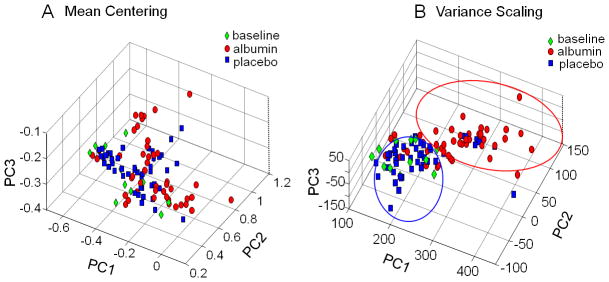
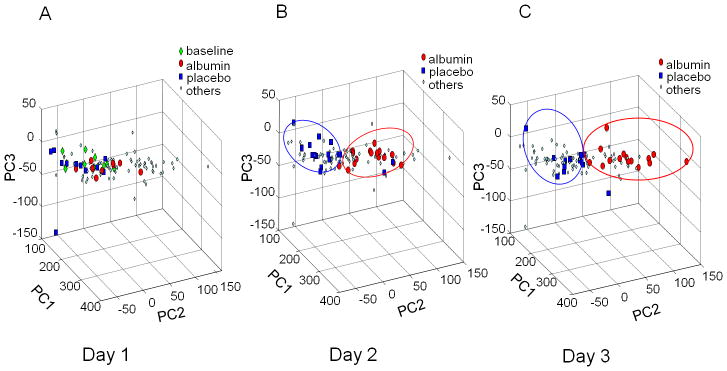
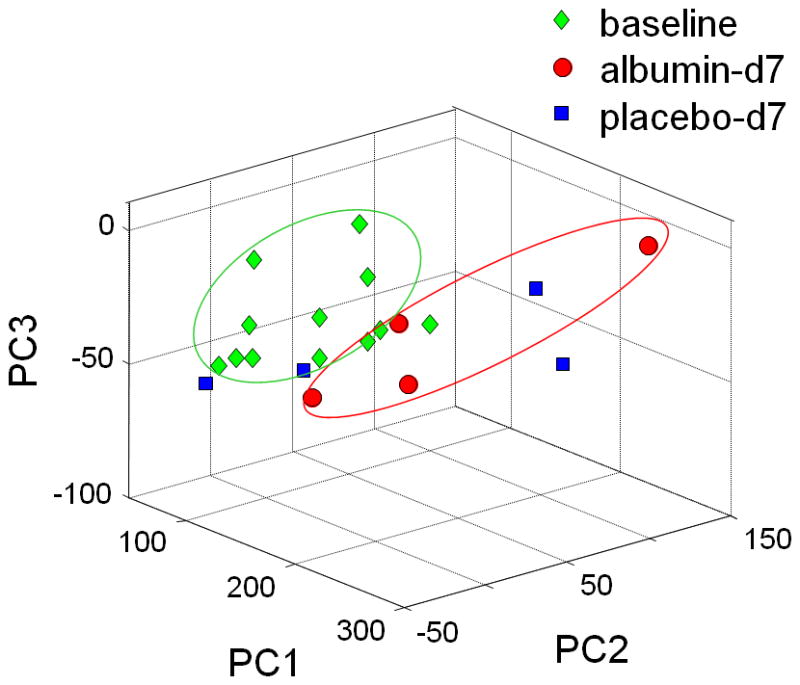
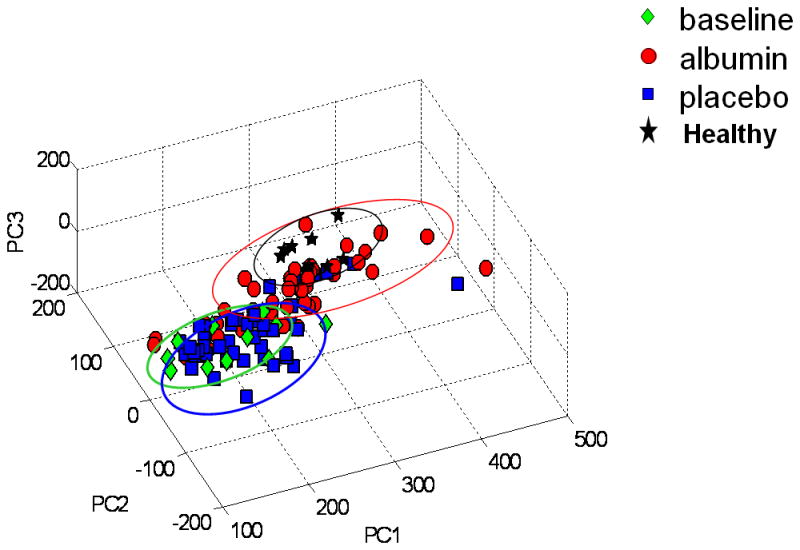
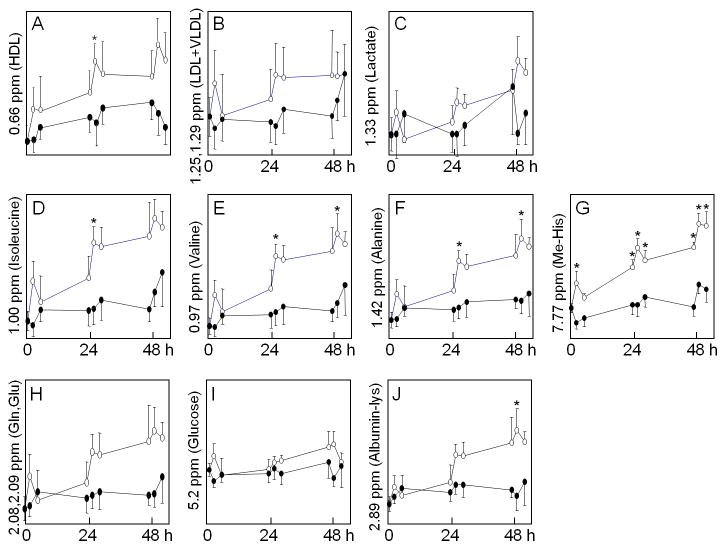
Measurements and main results: After 1 day of albumin therapy, changes in small molecules, including amino acids and plasma lipids, were evident with principal component analysis. Differences remained 3 days after the last albumin administration. Analysis of data along with spectra from healthy controls showed that spectra for patients receiving albumin had a trajectory toward the spectra observed for healthy individuals while those of the placebo controls did not.
Conclusion: The data suggest that metabolic changes detected by proton nuclear magnetic resonance spectroscopy and the bioinformatics tool may be a useful approach to clinical research, especially in acute lung injury.
Conflict of interest statement
The authors have not disclosed any potential conflicts of interest.
Figures
Comment in
-
Metabolomics in acute lung injury: a new approach for monitoring therapeutic interventions.Crit Care Med. 2011 Oct;39(10):2375-6. doi: 10.1097/CCM.0b013e31822818ca. Crit Care Med. 2011. PMID: 21926500 No abstract available.
Similar articles
-
Albumin influences total plasma antioxidant capacity favorably in patients with acute lung injury.Crit Care Med. 2004 Mar;32(3):755-9. doi: 10.1097/01.ccm.0000114574.18641.5d. Crit Care Med. 2004. PMID: 15090958 Clinical Trial.
-
A multicenter, randomized, double-blind, placebo-controlled, dose-escalation trial assessing safety and efficacy of active site inactivated recombinant factor VIIa in subjects with acute lung injury or acute respiratory distress syndrome.Crit Care Med. 2009 Jun;37(6):1874-80. doi: 10.1097/CCM.0b013e31819fff2c. Crit Care Med. 2009. PMID: 19384216 Clinical Trial.
-
Randomized, double-blind study of intravenous human albumin in hypoalbuminemic patients receiving total parenteral nutrition.Crit Care Med. 1997 Feb;25(2):249-52. doi: 10.1097/00003246-199702000-00009. Crit Care Med. 1997. PMID: 9034259 Clinical Trial.
-
Evaluation of metabolite profiles as biomarkers for the pharmacological effects of thiazolidinediones in Type 2 diabetes mellitus patients and healthy volunteers.Br J Clin Pharmacol. 2007 May;63(5):562-74. doi: 10.1111/j.1365-2125.2006.02816.x. Br J Clin Pharmacol. 2007. PMID: 17488363 Free PMC article. Clinical Trial.
-
Fluid Resuscitation with 5% albumin versus Normal Saline in Early Septic Shock: a pilot randomized, controlled trial.J Crit Care. 2012 Jun;27(3):317.e1-6. doi: 10.1016/j.jcrc.2011.10.007. Epub 2011 Dec 15. J Crit Care. 2012. PMID: 22176806 Clinical Trial.
Cited by
-
Cytotoxicity Activity, Metabolite Profiling, and Isolation Compound from Crude Hexane Extract of Cleome rutidospermae.Asian Pac J Cancer Prev. 2023 Oct 1;24(10):3345-3352. doi: 10.31557/APJCP.2023.24.10.3345. Asian Pac J Cancer Prev. 2023. PMID: 37898837 Free PMC article.
-
Pharmacometabolomics by NMR in Oncology: A Systematic Review.Pharmaceuticals (Basel). 2021 Oct 2;14(10):1015. doi: 10.3390/ph14101015. Pharmaceuticals (Basel). 2021. PMID: 34681239 Free PMC article. Review.
-
Nutritional metabolomics: progress in addressing complexity in diet and health.Annu Rev Nutr. 2012 Aug 21;32:183-202. doi: 10.1146/annurev-nutr-072610-145159. Epub 2012 Apr 23. Annu Rev Nutr. 2012. PMID: 22540256 Free PMC article. Review.
-
Sepsis, Management & Advances in Metabolomics.Nanotheranostics. 2024 Feb 25;8(3):270-284. doi: 10.7150/ntno.94071. eCollection 2024. Nanotheranostics. 2024. PMID: 38577320 Free PMC article. Review.
-
Advances in metabolomics in critically ill patients with sepsis and septic shock.Clin Exp Emerg Med. 2025 Mar;12(1):4-15. doi: 10.15441/ceem.24.211. Epub 2024 Jul 19. Clin Exp Emerg Med. 2025. PMID: 39026452 Free PMC article.
References
-
- Ware LB, Matthay MA. The acute respiratory distress syndrome. N Engl J Med. 2000;342(18):1334–1349. - PubMed
-
- Arif SK, Verheij J, Groeneveld AB, et al. Hypoproteinemia as a marker of acute respiratory distress syndrome in critically ill patients with pulmonary edema. Intensive Care Med. 2002;28(3):310–317. - PubMed
-
- Mangialardi RJ, Martin GS, Bernard GR, et al. Hypoproteinemia predicts acute respiratory distress syndrome development, weight gain, and death in patients with sepsis. Ibuprofen in Sepsis Study Group. Crit Care Med. 2000;28(9):3137–3145. - PubMed
-
- Wiedemann HP, Wheeler AP, Bernard GR, et al. Comparison of two fluid-management strategies in acute lung injury. N Engl J Med. 2006;354(24):2564–2575. - PubMed
Publication types
MeSH terms
Substances
Grants and funding
LinkOut - more resources
Full Text Sources
Other Literature Sources
