Comparative Study
. 2011 Jun 26;43(8):768-75.
doi: 10.1038/ng.865.

Increased methylation variation in epigenetic domains across cancer types

Affiliations
Comparative Study

Increased methylation variation in epigenetic domains across cancer types

Kasper Daniel Hansen et al. Nat Genet. .

Abstract

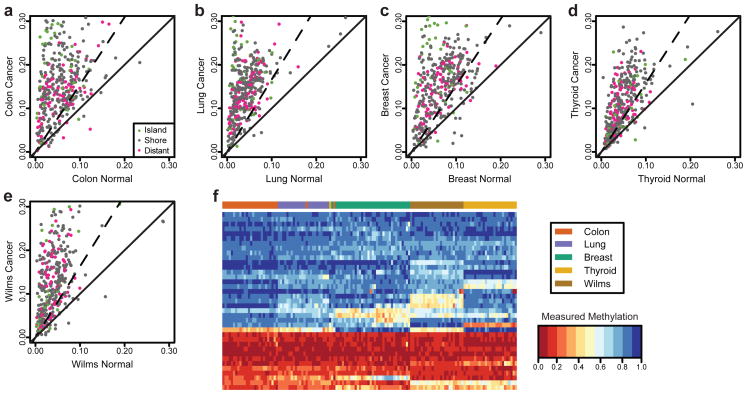
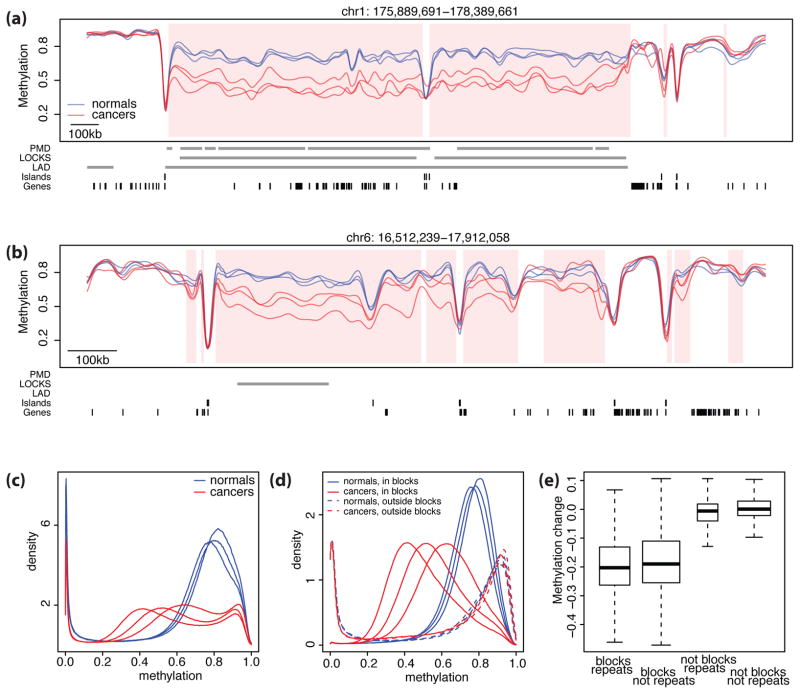
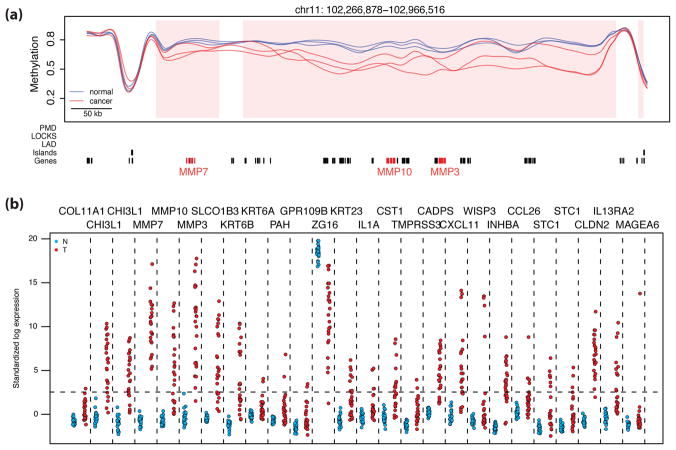
Tumor heterogeneity is a major barrier to effective cancer diagnosis and treatment. We recently identified cancer-specific differentially DNA-methylated regions (cDMRs) in colon cancer, which also distinguish normal tissue types from each other, suggesting that these cDMRs might be generalized across cancer types. Here we show stochastic methylation variation of the same cDMRs, distinguishing cancer from normal tissue, in colon, lung, breast, thyroid and Wilms' tumors, with intermediate variation in adenomas. Whole-genome bisulfite sequencing shows these variable cDMRs are related to loss of sharply delimited methylation boundaries at CpG islands. Furthermore, we find hypomethylation of discrete blocks encompassing half the genome, with extreme gene expression variability. Genes associated with the cDMRs and large blocks are involved in mitosis and matrix remodeling, respectively. We suggest a model for cancer involving loss of epigenetic stability of well-defined genomic domains that underlies increased methylation variability in cancer that may contribute to tumor heterogeneity.


Figures

Figure 1
Figure 1. Increased methylation variance of common CpG sites across human cancer types
Methylation levels measured at 384 CpG sites using a custom Illumina array exhibit an increase in across-sample variability in (a) colon, (b) lung, (c) breast, (d) thyroid, and (e) kidney (Wilms tumor) cancers. Each panel shows the across-sample standard deviation of methylation level for each CpG in normal and matched cancer samples. The solid line is the identity line; CpGs above this line have greater variability in cancer. The dashed line indicates the threshold at which differences in methylation variance become significant (F-test at 99% level). In all five tissue types, the vast majority of CpGs are above the solid line, indicating that variability is larger in cancer samples than in normal. Colors indicate the location of each CpG with respect to canonical annotated CpG islands. (f) Using the CpGs that showed the largest increase in variability we performed hierarchical clustering on the normal samples. The heatmap of the methylation values for these CpGs clearly distinguishes the tissue types, indicating that these sites of increased methylation heterogeneity in cancer are tissue-specific DMRs.
Figure 2
Figure 2. Large hypomethylated genomic blocks in human colon cancer
Shown in (a) and (b) are smoothed methylation values from bisulfite sequencing data for cancer samples (red) and normal samples (blue) in two genomic regions. The hypomethylated blocks are shown with pink shading. Grey bars indicate the location of PMDs, LOCKs, LADs, CpG Islands, and gene exons. Note that the blocks coincide with the PMD, LOCKS, and LADs in panel (a) but not in (b). Also one can see small hypermethylated blocks at the right edge, which account for 3% of the blocks. (c) The distribution of high-frequency smoothed methylation values for the normal samples (blue) versus the cancer samples (red) demonstrates global hypomethylation of cancer compared to normal. (d) The distribution of methylation values in the blocks (solid lines) and outside the blocks(dashed lines) for normal samples (blue) and cancer samples (red). Note that while the normal and cancer distributions are similar outside the blocks, within the blocks methylation values for cancer exhibit a general shift. (e) Distribution of methylation differences between cancer and normal samples stratified by inclusion in repetitive DNA and blocks. Inside the blocks, the average difference was ~−20% in both in repeat and non-repeat areas. Outside the blocks, the average difference was ~0% in repeat and non-repeat areas, indicating that blocks rather than repeats account for the observed differences in DNA methylation.
Figure 3
Figure 3. Loss of methylation stability at small DMRs
Methylation estimates plotted against genomic location for normal samples (blue) and cancer samples (red). The small DMR locations are shaded pink. Grey bars indicate the location of blocks, CpG islands, and gene exons. Tick marks along the bottom axis indicate the location of CpGs. Pictured are examples of (a) a methylation boundary shift outward, (b) a methylation boundary shift inward, (c) a loss of methylation boundary, and (d) a novel hypomethylation DMR.
Figure 4
Figure 4. Adenomas show intermediate methylation variability
(a) Multidimensional scaling of pairwise distances derived from methylation levels assayed on a custom Illumina array. Note that cancer samples (red) are largely far from the tight cluster of normal samples (blue), while adenoma samples (black) exhibit a range of distances: some are as close as other normal samples, others are as far as cancer samples, and many are at intermediate distances. (b) Multidimensional scaling of pairwise distances derived from average methylation values in blocks identified via bisulfite sequencing. Matching sequenced adenoma samples (labeled 1 and 2) appear in the same locations relative to the cluster of normal samples in both (a) and (b). (c) Methylation values for normal (blue), cancer (red) and two adenoma samples (black). Adenoma 1, which appeared closer to normal samples in the multidimensional scaling analysis (a), follows a similar methylation pattern to the normal samples. However, in some regions (shaded with pink) differences between Adenoma 1 and the normal samples are observed. Adenoma 2 shows a similar pattern to cancers.
Figure 5
Figure 5. High variability of gene expression associated with blocks
(a) An example of hypervariably expressed genes contained within a block; note genes MMP7, MMP10, and MMP3 highlighted in red. Methylation values for cancer samples (red) and normal samples (blue) with hypomethylated block locations highlighted (pink shading) are plotted against genomic location. Grey bars are as in Fig. 2. (b) Standardized log expression values for 26 hypervariable genes in cancer located within hypomethylated block regions (normal samples in blue, cancer samples in red). Standardization was performed using the gene expression barcode. Genes with standardized expression values below 2.54, or the 99.5th percentile of a normal distribution (horizontal dashed line) are determined to be silenced by the barcode method. Vertical dashed lines separate the values for the different genes. Note there is consistent expression silencing in normal samples compared to hypervariable expression in cancer samples. A similar plot drawn from an alternative GEO dataset is shown in Supplementary Figure 18.

Comment in

References

    1. Jones PA, Baylin SB. The fundamental role of epigenetic events in cancer. Nat Rev Genet. 2002;3:415–28. - PubMed
    1. Feinberg AP, Tycko B. The history of cancer epigenetics. Nat Rev Cancer. 2004;4:143–53. - PubMed
    1. Esteller M. Epigenetics in cancer. N Engl J Med. 2008;358:1148–59. - PubMed
    1. Irizarry RA, et al. The human colon cancer methylome shows similar hypo-and hypermethylation at conserved tissue-specific CpG island shores. Nat Genet. 2009;41:178–86. - PMC - PubMed
    1. Doi A, et al. Differential methylation of tissue-and cancer-specific CpG island shores distinguishes human induced pluripotent stem cells, embryonic stem cells and fibroblasts. Nat Genet. 2009;41:1350–3. - PMC - PubMed

Publication types

Associated data