. 2011 Jun 26;29(7):659-64.
doi: 10.1038/nbt.1882.

Direct measurement of DNA affinity landscapes on a high-throughput sequencing instrument

Affiliations

Direct measurement of DNA affinity landscapes on a high-throughput sequencing instrument

Razvan Nutiu et al. Nat Biotechnol. .

Abstract

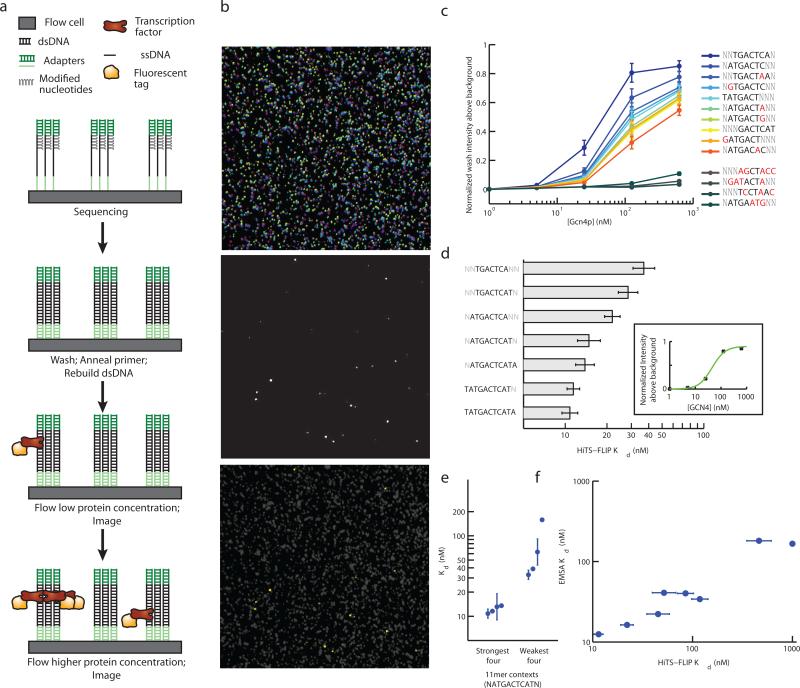
Several methods for characterizing DNA-protein interactions are available, but none have demonstrated both high throughput and quantitative measurement of affinity. Here we describe 'high-throughput sequencing'-'fluorescent ligand interaction profiling' (HiTS-FLIP), a technique for measuring quantitative protein-DNA binding affinity at unprecedented depth. In this approach, the optics built into a high-throughput sequencer are used to visualize in vitro binding of a protein to sequenced DNA in a flow cell. Application of HiTS-FLIP to the protein Gcn4 (Gcn4p), the master regulator of the yeast amino acid starvation response, yielded ~440 million binding measurements, enabling determination of dissociation constants for all 12-mer sequences having submicromolar affinity. These data revealed a complex interdependency between motif positions, allowed improved discrimination of in vivo Gcn4p binding sites and regulatory targets relative to previous methods and showed that sets of genes with different promoter affinities to Gcn4p have distinct functions and expression kinetics. Broad application of this approach should increase understanding of the interactions that drive transcription.


Figures

Figure 1
Figure 1. High-throughput sequencing fluorescent ligand interaction profile (HiTS-FLIP) method
a) HiTS-FLIP method schematic. A microfluidic flow cell with anchored single-stranded DNA is sequenced by synthesis. Second-strand DNA is stripped and rebuilt using Klenow and unmodified dNTPs to form dsDNA clusters. Fluorescently labeled Gcn4p is introduced at different concentrations and binding is imaged. b) Partial images from sequencing cycles (false colored for each nucleotide, top), a Gcn4p binding cycle (center), and a merge of the top and center with Gcn4p clusters highlighted in yellow (lower). The images shown represent roughly 0.003% of a flow cell. c) Intensity of binding versus Gcn4p concentration for the top ten 7mers (see text) and four 7mers with expected binding affinity near zero. Mismatches from the consensus sequence are marked in red. Error bars indicate 95% confidence intervals based on estimates from 5 flow cell lanes. d) Dissociation constants (Kd values) calculated by fitting a Hill equation to intensity measurements (inset; for TGACTCA). Top 7mer by Kd as well as selected extensions that had significantly increased affinity are shown. Error bars indicate standard deviation estimated from comparison of 5 flow cell lanes. e) Kd (mean and standard error) for 11mers containing the strongest-binding 9mer sequence, ATGACTCAT. The four 11mers with the strongest Kd (flanked by T,A; T,C; G,A; and C,A) and the four with the weakest Kd (flanked by C,T; A,G; A,C; and C,G) are shown. f) Dissociation constants measured by HiTS-FLIP (mean and standard error of 5 flow cell lanes) compared with those measured by EMSA (mean of duplicate experiments). Nine sequences chosen to have a wide range of expected binding affinity were assayed.
Figure 2
Figure 2. Positional interdependencies in the DNA binding affinity of Gcn4p
a) Mean dissociation constant (Kd) for the 3 sequences having one mismatch from the canonical 7mer at each position T1 through A7 for the forward strand and T1′ through A7′ for the reverse strand 7-mer. Dotted line represents the Kd for the canonical 7mer. Error bars represent standard error for the 3 sequences. b) Asymmetrical effect of substitutions on binding affinity. Top: 7mers with a single mismatch in the left half (T1 through C4) are compared to the symmetrical substitution in the reverse strand (T1′ through G4′); see equation for example. The log ratio of the geometric mean of binding affinities is shown for each position as a blue-yellow heat map. Bottom: As above, except that each row compares 7mers with an additional mismatch at the position indicated. c) Effect of a representative substitution at each position on free energy (ΔΔG) of binding. More positive values indicate positions where the reference nucleotide was more crucial for binding affinity. Specific substitutions (red) were defined relative to the consensus 7mer (black) or relative to a 7mer having a G2 to T2 substitution (blue). Significant differences between the two ΔΔG values (p < 0.05, z-test) are marked with asterisks. d) As in (c) except that blue bars indicate substitutions relative to a 7mer having an A3 to G3 substitution.
Figure 3
Figure 3. HiTS-FLIP accurately predicts in vivo binding and regulation and reveals impact of lower-affinity binding sites
a) Predictive power of protein-binding microarrays (PBMs) and HiTS-FLIP for in vivo Gcn4p bound regions (ChIP-chip and Ty5 datasets) and Gcn4p-induced genes, as measured by area under the curve (AUC). b) As in (a) except that the correlation between predicted Gcn4p occupancy and in vivo binding intensity or strength of induction is measured. Correlation is for top quintile of predicted bound genes. c) Genes were ranked by predicted occupancy using PBM data or HiTS-FLIP data and induction of genes under amino acid starvation conditions is shown by heat map, with small squares representing bins of genes. Red dotted lines indicate sample cutoffs of the 75th percentile for both methods. d) Gcn4p-sensitive genes are predicted using high-affinity k-mers (Kd < 400nM) or moderate-affinity k-mers (1uM > Kd > 400nM). Mean and standard error of fold-induction by 3-aminotriazole (3AT) treatment, triggering amino acid starvation, is plotted for genes ranking in the top quintile of high-affinity model, moderate-affinity model, both, or neither. Error bars represent ± one standard error.

References

    1. Klug SJ, Famulok M. All you wanted to know about SELEX. Mol Biol Rep. 1994;20:97–107. - PubMed
    1. Ren B, et al. Genome-wide location and function of DNA binding proteins. Science. 2000;290:2306–2309. - PubMed
    1. Mukherjee S, et al. Rapid analysis of the DNA-binding specificities of transcription factors with DNA microarrays. Nat Genet. 2004;36:1331–1339. - PMC - PubMed
    1. Johnson DS, Mortazavi A, Myers RM, Wold B. Genome-wide mapping of in vivo protein-DNA interactions. Science. 2007;316:1497–1502. - PubMed
    1. Zhao Y, Granas D, Stormo GD. Inferring binding energies from selected binding sites. PLoS Comput Biol. 2009;5:e1000590. - PMC - PubMed

Publication types

MeSH terms