A concerted decline in insulin secretion and action occurs across the spectrum of fasting and postchallenge glucose concentrations
- PMID: 21707690
- PMCID: PMC3983528
- DOI: 10.1111/j.1365-2265.2011.04159.x
A concerted decline in insulin secretion and action occurs across the spectrum of fasting and postchallenge glucose concentrations
Abstract
Aims/hypothesis: Individuals with impaired fasting glucose (IFG) are at increased risk of developing diabetes over the subsequent decade. However, there is uncertainty as to the mechanisms contributing to the development of diabetes. We sought to quantitate insulin secretion and action across the prediabetic range of fasting glucose.
Methods: We studied a cohort of 173 individuals with a fasting glucose concentration <7·0 mM after an overnight fast using a 75-g oral glucose tolerance test (OGTT). Insulin action (S(i)) was estimated using the oral glucose minimal model, and β-cell responsivity indices (φ) were estimated using the oral C-peptide minimal model. The disposition index (DI) for each individual was calculated. The relationship of DI, φ and S(i) with fasting and postchallenge glucose, as well as other covariates, was explored using a generalized linear regression model.
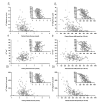
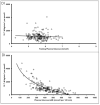
Results: In this cross-sectional study, S(i) and DI were inversely related to fasting glucose concentrations. On the other hand, φ was unrelated to fasting glucose concentrations. S(i), φ and DI were all inversely related to area above basal glucose concentrations after glucose challenge. Multiple parameters including body composition and gender contributed to the variability of S(i) and DI at a given fasting or postchallenge glucose concentration.
Conclusions/interpretation: Defects in insulin secretion and action interact with body composition and gender to influence postchallenge glucose concentrations. There is considerable heterogeneity of insulin secretion and action for a given fasting glucose likely because of patient subsets with isolated IFG and normal glucose tolerance.
© 2011 Blackwell Publishing Ltd.
Figures


References
-
- Tirosh A, Shai I, Tekes-Manova D, et al. Normal fasting plasma glucose levels and type 2 diabetes in young men. N Engl J Med. 2005;353:1454–1462. - PubMed
-
- Meigs JB, Nathan DM, D'Agostino RB, Sr., et al. Fasting and postchallenge glycemia and cardiovascular disease risk: the Framingham Offspring Study. Diabetes Care. 2002;25:1845–1850. - PubMed
-
- Dinneen SF, Maldonado D, 3rd, Leibson CL, et al. Effects of changing diagnostic criteria on the risk of developing diabetes. Diabetes Care. 1998;21:1408–1413. - PubMed
-
- Meigs JB, Muller DC, Nathan DM, et al. The natural history of progression from normal glucose tolerance to type 2 diabetes in the Baltimore Longitudinal Study of Aging. Diabetes. 2003;52:1475–1484. - PubMed
Publication types
MeSH terms
Substances
Grants and funding
- R01 DK078646/DK/NIDDK NIH HHS/United States
- R01 DK029953/DK/NIDDK NIH HHS/United States
- R01 HL055502/HL/NHLBI NIH HHS/United States
- P30 DK050456/DK/NIDDK NIH HHS/United States
- UL1 TR000135/TR/NCATS NIH HHS/United States
- DK29953/DK/NIDDK NIH HHS/United States
- RR24150/RR/NCRR NIH HHS/United States
- R37 DK029953/DK/NIDDK NIH HHS/United States
- DK 67071/DK/NIDDK NIH HHS/United States
- UL1 RR024150/RR/NCRR NIH HHS/United States
- R56 DK067071/DK/NIDDK NIH HHS/United States
- R01 DK067071/DK/NIDDK NIH HHS/United States
- DK78646/DK/NIDDK NIH HHS/United States
- HL-55502/HL/NHLBI NIH HHS/United States
- DK50456/DK/NIDDK NIH HHS/United States
LinkOut - more resources
Full Text Sources
Medical

