. 2011 Jun 27;8(1):44.
doi: 10.1186/1743-7075-8-44.

Involvement of gut microbial fermentation in the metabolic alterations occurring in n-3 polyunsaturated fatty acids-depleted mice

Affiliations

Involvement of gut microbial fermentation in the metabolic alterations occurring in n-3 polyunsaturated fatty acids-depleted mice

Barbara D Pachikian et al. Nutr Metab (Lond). .

Abstract

Background: Western diet is characterized by an insufficient n-3 polyunsaturated fatty acid (PUFA) consumption which is known to promote the pathogenesis of several diseases. We have previously observed that mice fed with a diet poor in n-3 PUFA for two generations exhibit hepatic steatosis together with a decrease in body weight. The gut microbiota contributes to the regulation of host energy metabolism, due to symbiotic relationship with fermentable nutrients provided in the diet. In this study, we have tested the hypothesis that perturbations of the gut microbiota contribute to the metabolic alterations occurring in mice fed a diet poor in n-3 PUFA for two generations (n-3/- mice).

Methods: C57Bl/6J mice fed with a control or an n-3 PUFA depleted diet for two generations were supplemented with prebiotic (inulin-type Fructooligosaccharides, FOS, 0.20 g/day/mice) during 24 days.

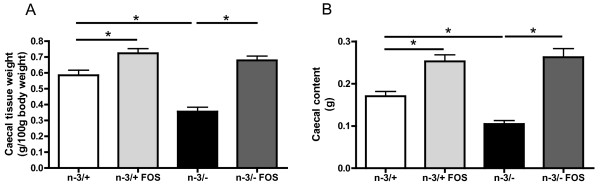
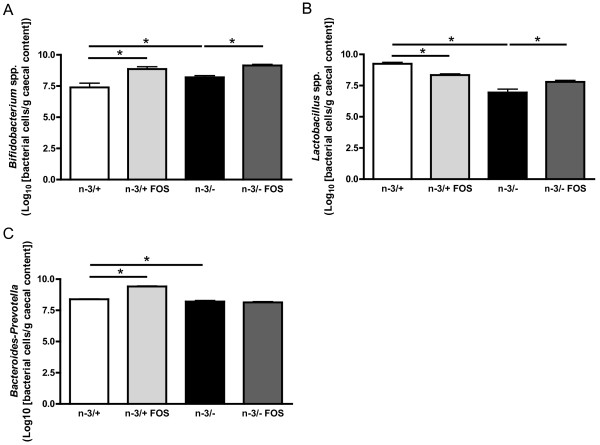
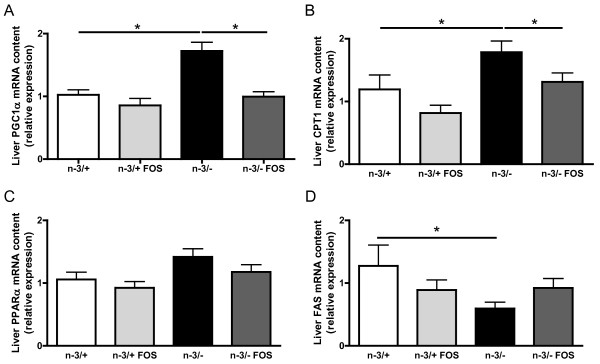
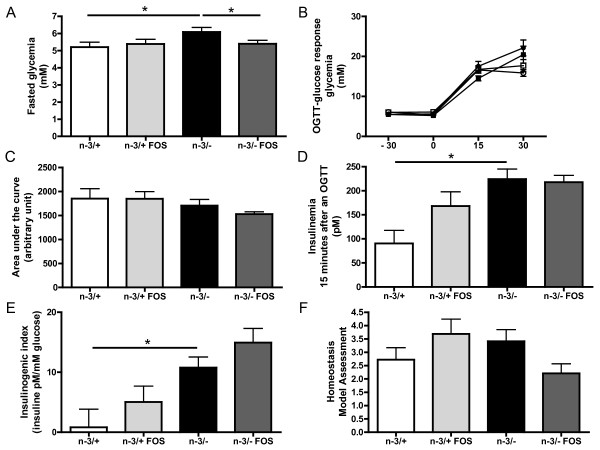
Results: n-3/-mice exhibited a marked drop in caecum weight, a decrease in lactobacilli and an increase in bifidobacteria in the caecal content as compared to control mice (n-3/+ mice). Dietary supplementation with FOS for 24 days was sufficient to increase caecal weight and bifidobacteria count in both n-3/+ and n-3/-mice. Moreover, FOS increased lactobacilli content in n-3/-mice, whereas it decreased their level in n-3/+ mice. Interestingly, FOS treatment promoted body weight gain in n-3/-mice by increasing energy efficiency. In addition, FOS treatment decreased fasting glycemia and lowered the higher expression of key factors involved in the fatty acid catabolism observed in the liver of n-3/-mice, without lessening steatosis.

Conclusions: the changes in the gut microbiota composition induced by FOS are different depending on the type of diet. We show that FOS may promote lactobacilli and counteract the catabolic status induced by n-3 PUFA depletion in mice, thereby contributing to restore efficient fat storage.


Figures

Figure 1
Figure 1
Caecal content and tissue weight. (A) caecal tissue weight (g/100 g body weight), (B) caecal content weight (g). Data are the mean ± SEM. *: mean values significantly different (P < 0.05, Student's t-test). n-3/+: mice fed with a control diet (n = 9), n-3/+ FOS: mice fed a control diet and supplemented with a prebiotic for 24 days (n = 10), n-3/-: mice fed an n-3 PUFA-depleted diet (n = 12), n-3/- FOS: mice fed an n-3 PUFA-depleted diet and supplemented with a prebiotic for 24 days (n = 12). The results have been partly reported in reference 20.
Figure 2
Figure 2
Microbial caecal content. (A) bifidobacterium spp., (B) lactobacillus spp., (C) bacteroides-prevotella. Bacterial quantities are expressed as Log10 (bacterial cells/g caecal content). Data are the mean ± SEM. *: mean values significantly different (P < 0.05, Student's t-test). -3/+: mice fed with a control diet (n = 9), n-3/+ FOS: mice fed a control diet and supplemented with a prebiotic for 24 days (n = 10), n-3/-: mice fed an n-3 PUFA-depleted diet (n = 12), n-3/- FOS: mice fed an n-3 PUFA-depleted diet and supplemented with a prebiotic for 24 days (n = 12).
Figure 3
Figure 3
Proximal colon proglucagon mRNA content. Data are the mean ± SEM. *: mean values significantly different (P < 0.05, Student's t-test). -3/+: mice fed with a control diet (n = 9), n-3/+ FOS: mice fed a control diet and supplemented with a prebiotic for 24 days (n = 10), n-3/-: mice fed an n-3 PUFA-depleted diet (n = 12), n-3/- FOS: mice fed an n-3 PUFA-depleted diet and supplemented with a prebiotic for 24 days (n = 12).
Figure 4
Figure 4
Hepatic mRNA pattern. (A) PGC1α: peroxisome proliferator-activated receptor gamma coactivator α, (B) CPT1: carnitine palmitoyl transferase 1, (C) PPARα: peroxisome proliferator-activated receptor α, (D) FAS: fatty acid synthase. Results are expressed as relative expression. Data are the mean ± SEM. *: mean values significantly different (P < 0.05, Student's t-test). -3/+: mice fed with a control diet (n = 9), n-3/+ FOS: mice fed a control diet and supplemented with a prebiotic for 24 days (n = 10), n-3/-: mice fed an n-3 PUFA-depleted diet (n = 12), n-3/- FOS: mice fed an n-3 PUFA-depleted diet and supplemented with a prebiotic for 24 days (n = 12). The results have been partly reported in reference 20.
Figure 5
Figure 5
Glucose homeostasis. (A) fasted glycemia (mM), (B) glycemia response (mM) after a glucose challenge in n-3/+ mice (closed squares), in n-3/+ FOS mice (closed circles), in n-3/- mice (open squares) and in n-3/- FOS mice (open circles), (C) area under the curve (arbitrary unit): glycemia response after an oral glucose load, (D) insulinemia 15 minutes after an oral glucose load, (E) insulinogenic index 15 minutes after an oral glucose load, (F) homeostasis model assessment of insulin resistance. Data are the mean ± SEM. *: mean values significantly different (P < 0.05, Student's t-test). -3/+: mice fed with a control diet (n = 9), n-3/+ FOS: mice fed a control diet and supplemented with a prebiotic for 24 days (n = 10), n-3/-: mice fed an n-3 PUFA-depleted diet (n = 12), n-3/- FOS: mice fed an n-3 PUFA-depleted diet and supplemented with a prebiotic for 24 days (n = 12). The results have been partly reported in reference 20.

Similar articles

Cited by

References

    1. Russo GL. Dietary n-6 and n-3 polyunsaturated fatty acids: from biochemistry to clinical implications in cardiovascular prevention. Biochem Pharmacol. 2009;77:937–946. doi: 10.1016/j.bcp.2008.10.020. - DOI - PubMed
    1. Browning LM, Krebs JD, Moore CS, Mishra GD, O'Connell MA, Jebb SA. The impact of long chain n-3 polyunsaturated fatty acid supplementation on inflammation, insulin sensitivity and CVD risk in a group of overweight women with an inflammatory phenotype. Diabetes Obes Metab. 2007;9:70–80. doi: 10.1111/j.1463-1326.2006.00576.x. - DOI - PubMed
    1. Yusof HM, Miles EA, Calder P. Influence of very long-chain n-3 fatty acids on plasma markers of inflammation in middle-aged men. Prostaglandins Leukot Essent Fatty Acids. 2008;78:219–228. doi: 10.1016/j.plefa.2008.02.002. - DOI - PubMed
    1. Nettleton JA, Katz R. n-3 long-chain polyunsaturated fatty acids in type 2 diabetes: a review. J Am Diet Assoc. 2005;105:428–440. doi: 10.1016/j.jada.2004.11.029. - DOI - PubMed
    1. Delarue J, Li CH, Cohen R, Corporeau C, Simon B. Interaction of fish oil and a glucocorticoid on metabolic responses to an oral glucose load in healthy human subjects. Br J Nutr. 2006;95:267–272. doi: 10.1079/BJN20051631. - DOI - PubMed

LinkOut - more resources