. 2011 Jun 27;13(3):R106.
doi: 10.1186/ar3387.

Defective response of CD4(+) T cells to retinoic acid and TGFβ in systemic lupus erythematosus

Affiliations

Defective response of CD4(+) T cells to retinoic acid and TGFβ in systemic lupus erythematosus

Eric S Sobel et al. Arthritis Res Ther. .

Abstract

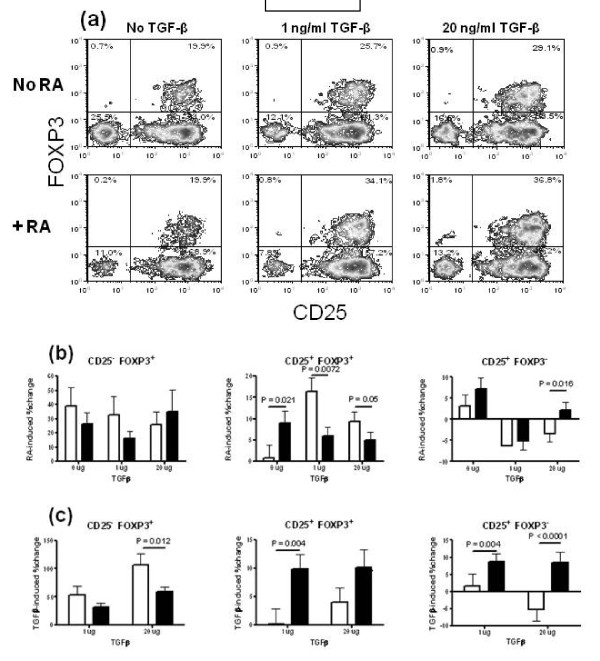
Introduction: CD25(+) FOXP3(+) CD4(+) regulatory T cells (Tregs) are induced by transforming growth factor β (TGFβ) and further expanded by retinoic acid (RA). We have previously shown that this process was defective in T cells from lupus-prone mice expressing the novel isoform of the Pbx1 gene, Pbx1-d. This study tested the hypothesis that CD4(+) T cells from systemic lupus erythematosus (SLE) patients exhibited similar defects in Treg induction in response to TGFβ and RA, and that PBX1-d expression is associated with this defect.

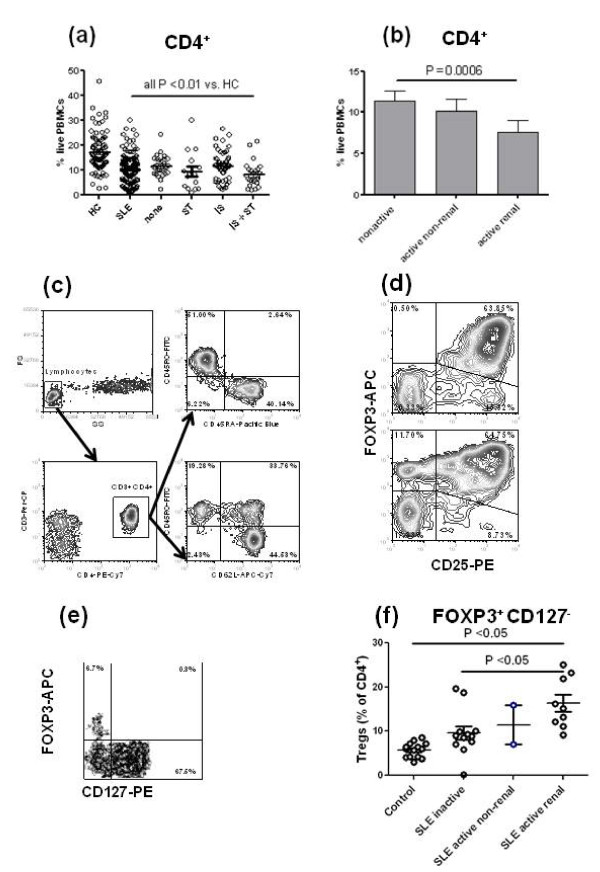
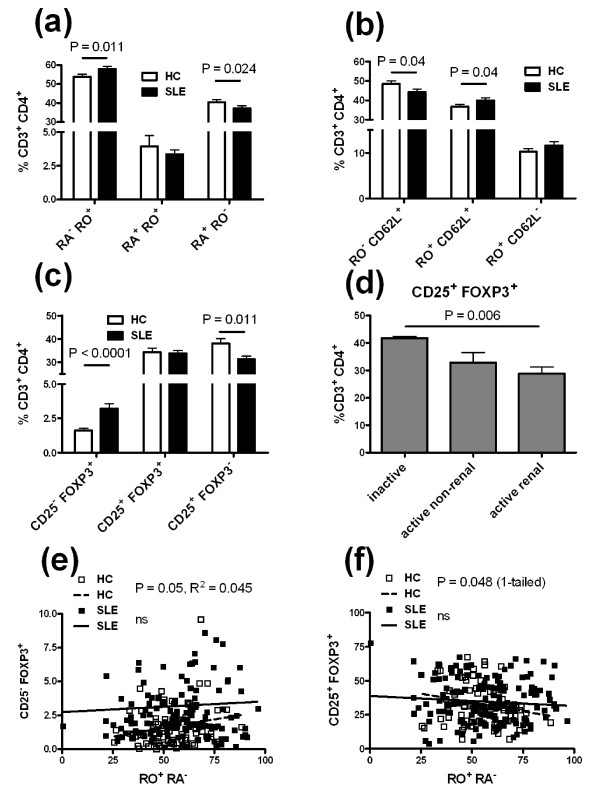
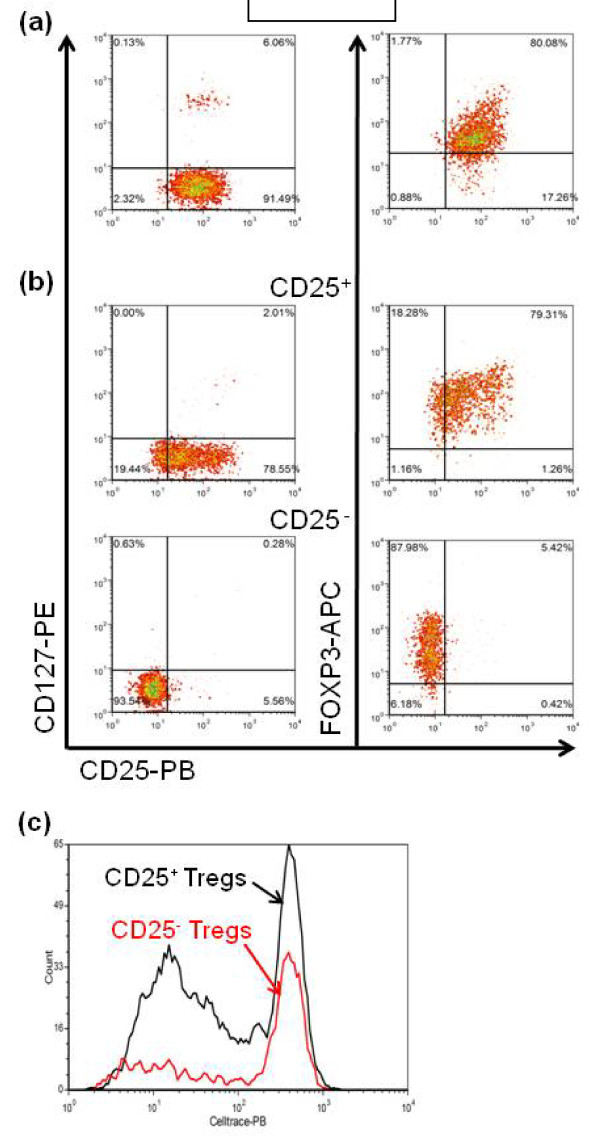
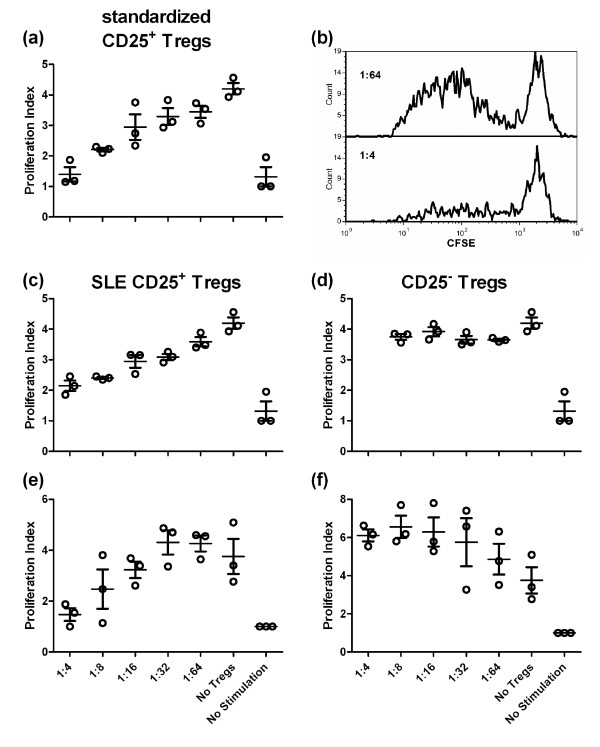
Methods: Peripheral blood mononuclear cells (PBMCs) were collected from 142 SLE patients and 83 healthy controls (HCs). The frequency of total, memory and naïve CD4(+) T cells was measured by flow cytometry on fresh cells. PBX1 isoform expression in purified CD4(+) T cells was determined by reverse transcription polymerase chain reaction (RT-PCR). PBMCs were stimulated for three days with anti-CD3 and anti-CD28 in the presence or absence of TGFβ and RA. The expression of CD25 and FOXP3 on CD4(+) T cells was then determined by flow cytometry. In vitro suppression assays were performed with sorted CD25(+) and CD25(-) FOXP3(+) T cells. CD4(+) T cell subsets or their expansion were compared between patients and HCs with two-tailed Mann-Whitney tests and correlations between the frequencies of two subsets were tested with Spearman tests.

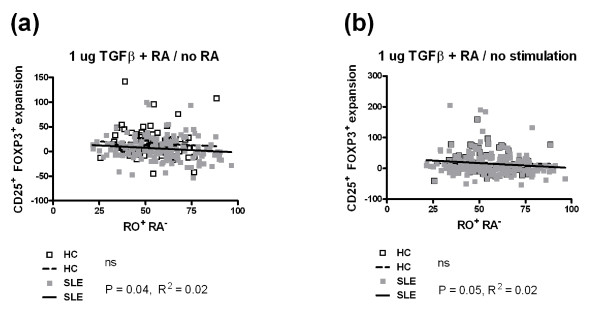
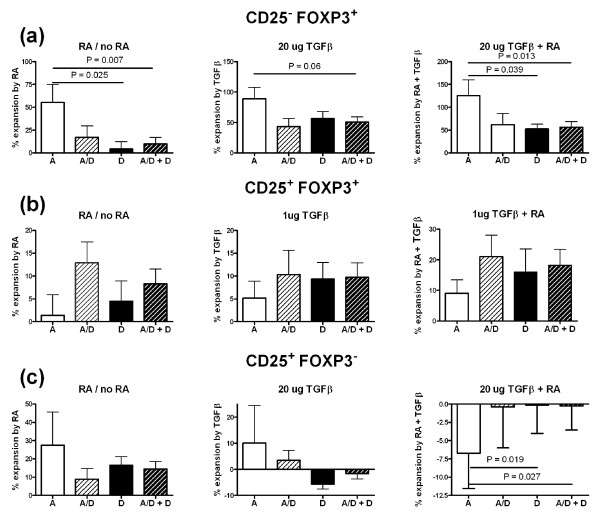
Results: The percentage of CD25(-) FOXP3(+) CD4(+) (CD25(-) Tregs) T cells was greater in SLE patients than in HCs, but these cells, contrary to their matched CD25(+) counterparts, did not show a suppressive activity. RA-expansion of TGFβ-induced CD25(+) Tregs was significantly lower in SLE patients than in HCs, although SLE Tregs expanded significantly more than HCs in response to either RA or TGFβ alone. Defective responses were also observed for the SLE CD25(-) Tregs and CD25(+) FOXP3(-) activated CD4(+) T cells as compared to controls. PBX1-d expression did not affect Treg induction, but it significantly reduced the expansion of CD25- Tregs and prevented the reduction of the activated CD25(+) FOXP3(-) CD4(+) T cell subset by the combination of TGFβ and RA.

Conclusions: We demonstrated that the induction of Tregs by TGFβ and RA was defective in SLE patients and that PBX1-d expression in CD4(+) T cells is associated with an impaired regulation of FOXP3 and CD25 by TGFβ and RA on these cells. These results suggest an impaired integration of the TGFβ and RA signals in SLE T cells and implicate the PBX1 gene in this process.


Figures

Figure 1
Figure 1
CD3+ CD4+ T cell leucopenia in systemic lupus erythematosus (SLE) patients. (a) Percentage of CD4+ T cells in the peripheral blood mononuclear cells (PBMCs) of patients and healthy controls (HCs). CD4+ T cell percentages was also compared between untreated patients (none, N = 28) and patients treated with either steroids alone (ST, N = 15) or immunosuppressive drugs alone (IS, N = 53) or both (IS + ST, N = 32). Each patient group was compared to HCs using Dunns' multiple comparison tests. (b) Percentage of CD4+ T cells in the PBMCs of SLE patients according to their disease activity (non-active, active non-renal and active renal). (c) Representative PBMC fluorescence activated cell sorter (FACS) plots showing the CD45RO - CD45RA and CD45RO - CD62L stainings gated on CD3+ CD4+ lymphocytes. (d) Representative FACS plots showing FOXP3 and CD25 staining gated on CD4+ lymphocytes of two PBMC samples three days after stimulation with anti-CD3 and anti-CD28. (e) Freshly obtained blood was stained with a combination of antibodies to CD3, CD4, CD25, and CD127. Following red blood cell lysis, the cells were permeabilized and stained for FOXP3 expression. The FACS plot shows a representative profile gated on CD3+ CD4+ lymphocytes, with the regulatory T cells (Tregs) being identified as FOXP3+ CD127-. (f) Percentage of circulating Tregs identified as shown in (e) in HCs and SLE patients partitioned by disease activity.
Figure 2
Figure 2
Differential CD3+ CD4+ T cell subset distribution between healthy controls and systemic lupus erythematosus patients Distribution of CD45RA- CD45RO+ (RA- RO+) memory T cells and CD45RA+ CD45RO- (RA+ RO-) naïve T cells (a), or CD45RO- (RO-) CD62L+ naïve T cells, CD45RO+ (RO+) CD62L+ central memory T cells and CD45RO+ (RO+) CD62L- effector memory T cells in the peripheral blood mononuclear cells (PBMCs) of SLE patients and HCs (b). (c) CD4+ T cells activated for three days with anti-CD3 and anti-CD28 were compared between patients and HCs according to their CD25 and FOXP3 expression. (d) Percentage of expanded CD25+ regulatory T cells (Tregs) in SLE patients according to their disease activity. (e) The percentage of CD25- Tregs was positively correlated with the percentage of memory CD45RO+ CD45RA- CD4+ T cells in HCs but not in patients. (f) The percentage of CD25+ Tregs was negatively correlated (one-tail P-value) with the percentage of memory CD45RO+ CD45RA- CD4+ T cells in HCs but not in patients. The graphs in (e-f) show the linear regression lines for HCs (dashed) and SLE patients (plain), the P-values for the Spearman correlation tests and the R2 values calculated separately for the patient and HC cohorts. Ns, non-significant.
Figure 3
Figure 3
Representative fluorescence activated cell sorter (FACS) plots showing the regulatory T cell (Treg) populations used in the suppression assays (a) Standardized cord blood Treg used as positive controls, the great majority of which being CD127- CD25+ FOXP3+. (b) Treg isolated from a systemic lupus erythematosus (SLE) patient as CD4+ CD127-, then sorted as CD25+ or CD25- after stimulation and expansion with transforming growth factor beta (TGFβ) and retinoic acid (RA). The CD25+-sorted population was approximately 80% FoxP3+ CD25+, while the CD25--sorted population was more than 80% FoxP3+ CD25-. (c) Proliferation of CD25+ and CD25- Treg isolated from a same patient in the presence of standardized peripheral blood mononuclear cells (PBMCs) at the same dilution (1:4), in the presence of anti-CD3 and anti-CD28 for six days, showing a robust response of the CD25+ as opposed to the CD25- Tregs.
Figure 4
Figure 4
CD25+ but not CD25- regulatory T cells (Tregs) expanded from systemic lupus erythematosus (SLE) patients suppressed T cell proliferation. Standardized aliquots of peripheral blood mononuclear cells (PBMCs) were cultured for six days in the presence of standardized Tregs (a), CD25+ (c, e) or CD25- (d, f) Tregs expanded in vitro from the PBMCs of SLE patients in the presence of transforming growth factor beta (TGFβ) and retinoic acid (RA). (c-d) and (e-f) CD25+ and CD25- Tregs were obtained from a same patient. Representative profiles of the CD8+ PBMC proliferation in the presence of CD25+ Tregs at the indicated dilutions are depicted (b). A varying amount of suppression was mediated by the CD25+ population, while the CD25- population showed either no effect (top) or appeared to promote proliferation (bottom). These data are representative of six patients prepared in three independent experiments.
Figure 5
Figure 5
Differential induction of CD25 and FOXP3 expression by retinoic acid (RA) and (transforming growth factor beta (TGFβ) in healthy controls (HCs) and systemic lupus erythematosus (SLE) patients. (a) Representative fluorescence activated cell sorter (FACS) plots showing FOXP3 and CD25 staining in CD4+ gated peripheral blood mononuclear cells (PBMCs) after three days stimulation with anti-CD3 and anti-CD28 with or without RA and in the presence of 0, 1, or 20 ug/ml of TGFβ. In the (b-d) panels, CD25- regulatory T cells (Tregs) are shown on the left, Tregs in the middle, and CD25+ FOXP3- CD4+ T cells on the right. (b) RA-induced expansion in the presence of 0, 1, or 20 ug/ml of TGFβ. The graphs show the ((RA - no RA)/no RA) values for each TGFβ concentration. (c) TGFβ-induced expansion in the absence of RA. The graphs show the ((TGFβ - no TGFβ)/no TGFβ) values for each concentration of TGFβ. HCs are represented by white symbols and SLE patients by black symbols.
Figure 6
Figure 6
Memory CD45RO+ CD45RA- CD4+ T cells are associated with a lower induction of FOXP3 by (transforming growth factor beta) TGFβ and retinoic acid (RA) in systemic lupus erythematosus (SLE) patients. (a) Treg expansion by RA in the presence of 1 ug/ml of TGFβ was negatively correlated with the percentage of memory CD4+ T cells in the peripheral blood mononuclear cells (PBMCs) of SLE patients but not healthy controls (HCs). (b) Treg expansion by the combination of RA and 1 ug/ml of TGFβ over the absence of both RA and TGFβ was negatively correlated with the percentage of memory CD4+ T cells in the PBMCs of SLE patients but not HCs. HCs are represented by white symbols and dashed linear regression lines; SLE patients are represented by grey symbols and plain linear regression lines. The P-values for Spearman correlation tests and the R2 values are shown for the patient and HC cohorts. Ns, non-significant.
Figure 7
Figure 7
PBX1-D expression affects FOXP3 and CD25 induction by retinoic acid and (transforming growth factor beta). Combined CD4+ T cells from systemic lupus erythematosus patients (SLE) and healthy controls (HCs) were partitioned according to their expression of the PBX1-A (white), PBX1-D (black), co-expression of both PBX1-A and PBX1-D (A/D, light hatched) or either PBX1-D or PBX1-A/D (heavy hatched) isoforms. The expansion of CD25- regulatory T cells (Tregs) (a), Tregs (b) and CD25+ FOXP3- CD4+ T cells (c) is shown by retinoic acid (RA) alone (left panels), transforming growth factor beta (TGFβ) alone (middle panels), or the combination of the two (right panels).

Similar articles

Cited by

References

    1. Shlomchik MJ, Craft JE, Mamula MJ. From T to B and back again: positive feedback in systemic autoimmune disease. Nat Rev Immunol. 2001;1:147–153. doi: 10.1038/35100573. - DOI - PubMed
    1. La Cava A. Lupus and T cells. Lupus. 2009;18:196–201. doi: 10.1177/0961203308098191. - DOI - PubMed
    1. Messner RP, Lindstrom FD, Williams RC Jr. Peripheral blood lymphocyte cell surface markers during the course of systemic lupus erythematosus. J Clin Invest. 1973;52:3046–3056. doi: 10.1172/JCI107503. - DOI - PMC - PubMed
    1. Glinski W, Gershwin ME, Steinberg AD. Fractionation of cells on a discontinuous Ficoll gradient. Study of subpopulations of human T cells using anti-T-cell antibodies from patients with systemic lupus erythematosus. J Clin Invest. 1976;57:604–614. doi: 10.1172/JCI108316. - DOI - PMC - PubMed
    1. Rivero SJ, az-Jouanen E, Alarcon-Segovia D. Lymphopenia in systemic lupus erythematosus. Clinical, diagnostic, and prognostic significance. Arthritis Rheum. 1978;21:295–305. doi: 10.1002/art.1780210302. - DOI - PubMed

Publication types

MeSH terms

Substances