

Tissue-specific compartmental analysis for dynamic contrast-enhanced MR imaging of complex tumors
- PMID: 21708498
- PMCID: PMC6309689
- DOI: 10.1109/TMI.2011.2160276
Tissue-specific compartmental analysis for dynamic contrast-enhanced MR imaging of complex tumors
Abstract
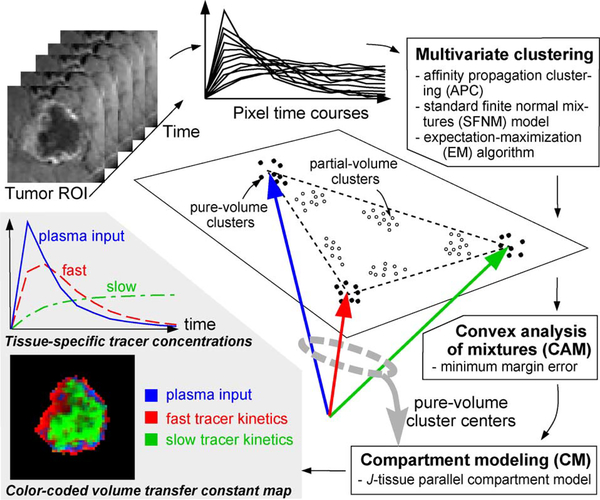
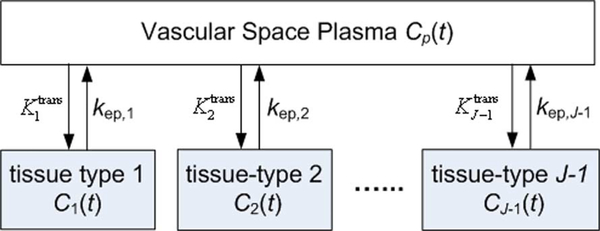
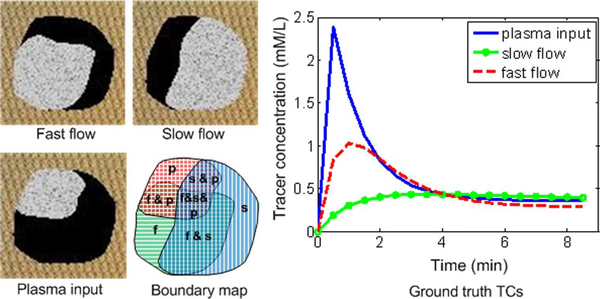
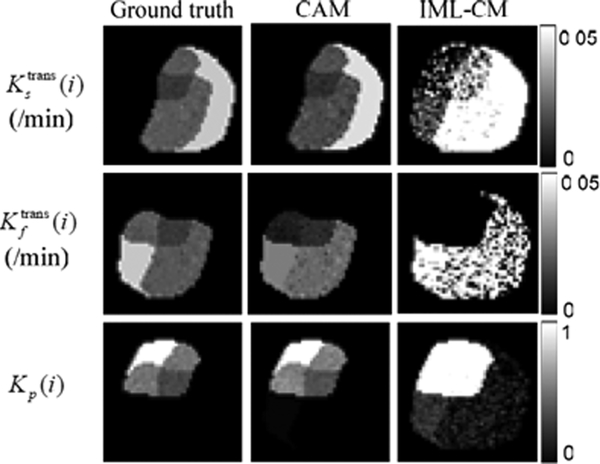
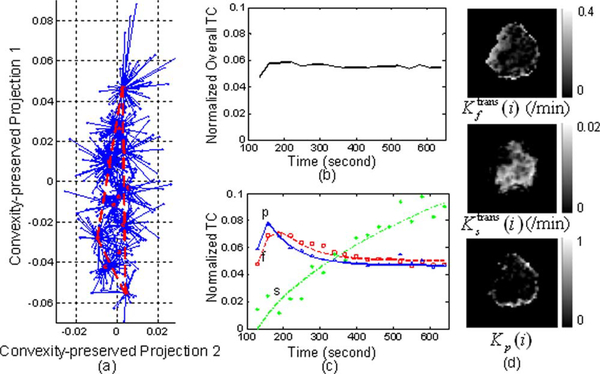
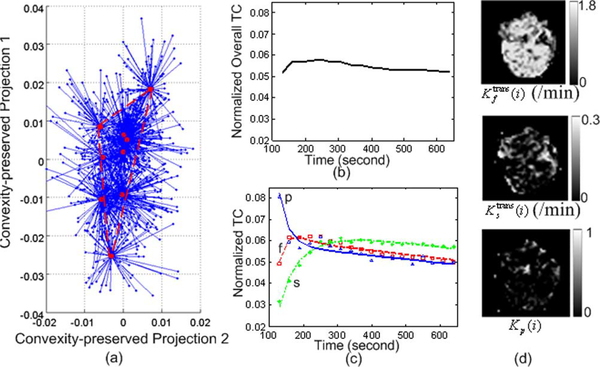
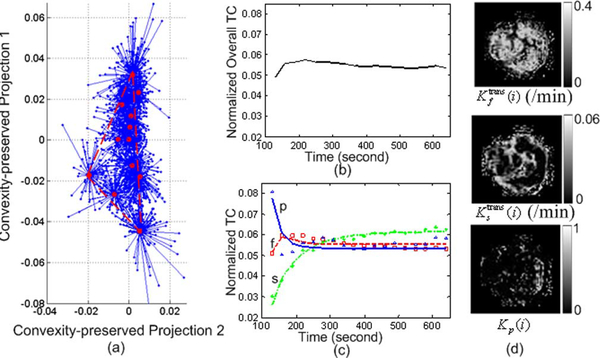
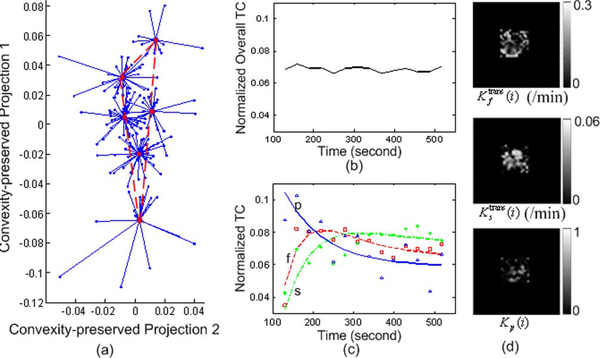
Dynamic contrast-enhanced magnetic resonance imaging (DCE-MRI) provides a noninvasive method for evaluating tumor vasculature patterns based on contrast accumulation and washout. However, due to limited imaging resolution and tumor tissue heterogeneity, tracer concentrations at many pixels often represent a mixture of more than one distinct compartment. This pixel-wise partial volume effect (PVE) would have profound impact on the accuracy of pharmacokinetics studies using existing compartmental modeling (CM) methods. We, therefore, propose a convex analysis of mixtures (CAM) algorithm to explicitly mitigate PVE by expressing the kinetics in each pixel as a nonnegative combination of underlying compartments and subsequently identifying pure volume pixels at the corners of the clustered pixel time series scatter plot simplex. The algorithm is supported theoretically by a well-grounded mathematical framework and practically by plug-in noise filtering and normalization preprocessing. We demonstrate the principle and feasibility of the CAM-CM approach on realistic synthetic data involving two functional tissue compartments, and compare the accuracy of parameter estimates obtained with and without PVE elimination using CAM or other relevant techniques. Experimental results show that CAM-CM achieves a significant improvement in the accuracy of kinetic parameter estimation. We apply the algorithm to real DCE-MRI breast cancer data and observe improved pharmacokinetic parameter estimation, separating tumor tissue into regions with differential tracer kinetics on a pixel-by-pixel basis and revealing biologically plausible tumor tissue heterogeneity patterns. This method combines the advantages of multivariate clustering, convex geometry analysis, and compartmental modeling approaches. The open-source MATLAB software of CAM-CM is publicly available from the Web.
Figures
Similar articles
-
Enhancing the convex analysis of mixtures technique for estimating DCE-MRI pharmacokinetic parameters.Annu Int Conf IEEE Eng Med Biol Soc. 2014;2014:6434-7. doi: 10.1109/EMBC.2014.6945101. Annu Int Conf IEEE Eng Med Biol Soc. 2014. PMID: 25571469
-
A multicompartment model for intratumor tissue-specific analysis of DCE-MRI using non-negative matrix factorization.Med Phys. 2021 May;48(5):2400-2411. doi: 10.1002/mp.14793. Epub 2021 Mar 25. Med Phys. 2021. PMID: 33608885
-
CAM-CM: a signal deconvolution tool for in vivo dynamic contrast-enhanced imaging of complex tissues.Bioinformatics. 2011 Sep 15;27(18):2607-9. doi: 10.1093/bioinformatics/btr436. Epub 2011 Jul 23. Bioinformatics. 2011. PMID: 21785131 Free PMC article.
-
Tracer kinetic analysis of signal time series from dynamic contrast-enhanced MR imaging.Biomed Tech (Berl). 2006 Dec;51(5-6):325-30. doi: 10.1515/BMT.2006.065. Biomed Tech (Berl). 2006. PMID: 17155868 Review.
-
Tracer-kinetic modeling of dynamic contrast-enhanced MRI and CT: a primer.J Pharmacokinet Pharmacodyn. 2013 Jun;40(3):281-300. doi: 10.1007/s10928-013-9315-3. Epub 2013 Apr 6. J Pharmacokinet Pharmacodyn. 2013. PMID: 23563847 Review.
Cited by
-
Acceleration of dynamic fluorescence molecular tomography with principal component analysis.Biomed Opt Express. 2015 May 8;6(6):2036-55. doi: 10.1364/BOE.6.002036. eCollection 2015 Jun 1. Biomed Opt Express. 2015. PMID: 26114027 Free PMC article.
-
Integration of Network Biology and Imaging to Study Cancer Phenotypes and Responses.IEEE/ACM Trans Comput Biol Bioinform. 2014 Nov-Dec;11(6):1009-19. doi: 10.1109/TCBB.2014.2338304. Epub 2014 Jul 16. IEEE/ACM Trans Comput Biol Bioinform. 2014. PMID: 25750594 Free PMC article.
-
Imaging intratumor heterogeneity: role in therapy response, resistance, and clinical outcome.Clin Cancer Res. 2015 Jan 15;21(2):249-57. doi: 10.1158/1078-0432.CCR-14-0990. Epub 2014 Nov 24. Clin Cancer Res. 2015. PMID: 25421725 Free PMC article. Review.
-
FSCAM: CAM-Based Feature Selection for Clustering scRNA-seq.Interdiscip Sci. 2022 Jun;14(2):394-408. doi: 10.1007/s12539-021-00495-8. Epub 2022 Jan 14. Interdiscip Sci. 2022. PMID: 35028910
-
Convex Analysis of Mixtures for Separating Non-negative Well-grounded Sources.Sci Rep. 2016 Dec 6;6:38350. doi: 10.1038/srep38350. Sci Rep. 2016. PMID: 27922124 Free PMC article.
References
-
- McDonald DM and Choyke PL, “Imaging of angiogenesis: From microscope to clinic,” Nature Medicine, vol. 9, pp. 713–725, 2003. - PubMed
-
- Li K-L et al., “Heterogeneity in the angiogenic response of a BT474 human breast cancer to a novel vascular endothelial growth factor-receptor tyrosine kinase inhibitor: Assessment by voxel analysis of dynamic contrast-enhanced MRI,” J. Magn. Reson. Imag, vol. 22, pp. 511–519, 2005. - PubMed
-
- Padhani AR, “MRI for assessing antivascular cancer treatments,” British Journal of Radiology, vol. 76, pp. S60–80, Dec. 2003. - PubMed
-
- Parker GJM et al., “Probing tumor microvascularity by measurement, analysis and display of contrast agent uptake kinetics,” J. Magn. Reson. Imag, vol. 7, pp. 564–574, 1997. - PubMed
-
- Jain RK, “Normalization of tumor vasculature: An emerging concept in antiangiogenic therapy,” Science, vol. 307, pp. 58–62, Jan. 2005. - PubMed
Publication types
MeSH terms
Grants and funding
LinkOut - more resources
Full Text Sources
Medical
