. 2011 Jul 4;208(7):1403-17.
doi: 10.1084/jem.20101995. Epub 2011 Jun 27.

E4F1 deficiency results in oxidative stress-mediated cell death of leukemic cells

Affiliations

E4F1 deficiency results in oxidative stress-mediated cell death of leukemic cells

Elodie Hatchi et al. J Exp Med. .

Abstract

The multifunctional E4F1 protein was originally discovered as a target of the E1A viral oncoprotein. Growing evidence indicates that E4F1 is involved in key signaling pathways commonly deregulated during cell transformation. In this study, we investigate the influence of E4F1 on tumorigenesis. Wild-type mice injected with fetal liver cells from mice lacking CDKN2A, the gene encoding Ink4a/Arf, developed histiocytic sarcomas (HSs), a tumor originating from the monocytic/macrophagic lineage. Cre-mediated deletion of E4F1 resulted in the death of HS cells and tumor regression in vivo and extended the lifespan of recipient animals. In murine and human HS cell lines, E4F1 inactivation resulted in mitochondrial defects and increased production of reactive oxygen species (ROS) that triggered massive cell death. Notably, these defects of E4F1 depletion were observed in HS cells but not healthy primary macrophages. Short hairpin RNA-mediated depletion of E4F1 induced mitochondrial defects and ROS-mediated death in several human myeloid leukemia cell lines. E4F1 protein is overexpressed in a large subset of human acute myeloid leukemia samples. Together, these data reveal a role for E4F1 in the survival of myeloid leukemic cells and support the notion that targeting E4F1 activities might have therapeutic interest.


Figures

Figure 1.
Figure 1.
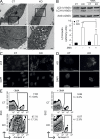
Development of a mouse model of HS harboring the E4F1 conditional KO allele. (A) Schematic representation of the different E4F1flox, RERT KI, and Ink4a/Arf-null alleles. (B) RT-qPCR and immunoblot (IB) analyses of E4F1 expression in tissues isolated from E4F1+/flox; RERTKI/KI (CT) or E4F1−/flox; RERTKI/KI (KO) mice after repeated administration of 4OHT. RT-qPCR products were loaded on agarose gels (top) after real-time PCR amplification to verify fragment size and purity of amplicons. HPRT mRNA and GAPDH protein were used to normalize RT-qPCR and immunoblots, respectively. Bar graph shows mean ± SD (n = 3) of RT-qPCR data. BM cells represent total BM cells. BM Lin (lineage negative) cells represent a fraction of purified BM cells enriched in HSCs and progenitor cells that were negatively selected for expression of lineage-specific markers (CD3, B220, Ter119, Gr-1, and Mac1). **, P < 0.01; ***, P < 0.001. (C) Microphotographs of representative H&E-stained histological lung and liver sections from transplanted mice. Dashed lines indicate the edge of the infiltrating HS. Insets show high-magnification images of HS cells exhibiting large eosinophilic cytoplasm and reniform nucleus. (D) Immunophenotypical analysis of HS. Representative tumors observed in the lung and liver were analyzed by IHC using antibodies for the proliferation marker Ki67 (brown staining) and the histiocytic marker F4/80 (dark purple staining), as indicated. Insets show high-magnification images of HS cells. Bars, 50 µm.
Figure 2.
Figure 2.
E4F1 inactivation results in decreased tumor development and increased lifespan. (A) Kaplan-Meier survival curve of recipients transplanted with fetal liver cells from E4F1+/flox; Ink4a/Arf+/+ (n = 8), E4F1−/flox; Ink4a/Arf+/+ (n = 16), E4F1+/flox; Ink4a/Arf−/− (CT; n = 24), and E4F1−/flox; Ink4a/Arf−/− (KO; n = 30) mice, as indicated. The arrow indicates the first 4OHT administration. The dashed lines indicate the median survival time (50% lived animals), and the double-headed arrow shows the difference in that median survival time between the two experimental groups: E4F1 WT; Ink4a/Arf KO and E4F1 KO; Ink4a/Arf KO. Statistically significant differences for pairwise comparison were evaluated by a log-rank test. *, P = 0.005. (B) IHC analyses of lung sections of E4F1 CT or KO mice stained with an antibody for the Mac2 histiocytic-specific marker. Representative microphotographs at low and high magnification are shown. Bars: (left) 1 mm; (right) 100 µm. (C) Spleen weight of E4F1 CT or KO animals. A microphotograph of spleen from a representative E4F1 CT or KO mouse is shown. Untransplanted tumor-free mice (normal spleen) were used as controls (median ± SD; n = 17 for each group; ***, P < 0.001).
Figure 3.
Figure 3.
E4F1 inactivation results in cell death and tumor regression in established HSs. (A and B) [18F]FDG-based PET scan analyses were performed on individual E4F1+/flox; RERTKI/KI; Ink4a/Arf−/− and E4F1−/flox; RERTKI/KI; Ink4a/Arf−/− mice before (top) or 2 wk after (bottom) repeated administrations of 4OHT (n = 4 for each group). (A) Representative images showing HSs in the spleen (red dashed lines) and liver (white dashed lines). The color code indicates radioactivity intensity (arbitrary units) representing [18F]FDG uptake. Note that strong PET signal in heart and pectoral muscles precluded analysis of tumor progression in the lungs. (B) Quantitative analysis of PET imaging performed on the spleen and liver (fold change representing the ratio between PET signal after 15 d [D15] and before [D0] 4OHT administration to E4F1 CT or KO mice; median ± SD of four animals for each genotype; *, P < 0.05). (C) Representative microphotograph of TUNEL staining performed on lung tissue sections prepared from E4F1+/flox; RERTKI/KI; Ink4a/Arf−/− (CT) and E4F1−/flox; RERTKI/KI; Ink4a/Arf−/− (KO) mice 15 d after 4OHT administration. Sections were colabeled with TUNEL, Mac2, and DAPI, as indicated. Merge images (Mac2, red; TUNEL, green) are shown at higher magnification (boxed areas). Bars, 50 µm.
Figure 4.
Figure 4.
E4F1 inactivation induces massive cell death of HS cells. E4F1−/flox; RERTKI/KI; Ink4a/Arf−/− HS cells were cultured in the presence (KO) or absence (CT) of 4OHT. (A) 3 d after vehicle or 4OHT addition in the culture medium, HS cells were analyzed by immunoblot and counted (mean ± SD; n = 6; ***, P < 0.001). GAPDH was used as a loading control. (B) Proliferation rate and mitotic index upon E4F1 inactivation in HS cells. The percentage of EdU (left)- or phospho–histone H3 (S10; PHH3; right)–positive cells was evaluated by flow cytometry. Nocodazole treatment (Noco) of E4F1 CT HS cells was used as a control for PHH3 staining. Bar graphs represent the mean ± SD (n = 3). (C) Representative microphotographs (top) of E4F1 CT and KO HS cells 4 d after 4OHT addition. Flow cytometry analyses (bottom) of annexin V–positive cells in E4F1 CT and KO HS cells (numbers indicate the mean ± SD of n = 7; P < 0.001). Bar, 5 µm. (D) 105 E4F1 CT and KO HS cells were seeded in soft agar. Bar graph shows quantitative evaluation of the total number of colonies formed after 3 wk of culture (mean ± SD; n = 3; ***, P < 0.001).
Figure 5.
Figure 5.
E4F1 inactivation in HS cells results in autophagic cell death. E4F1−/flox; RERTKI/KI; Ink4a/Arf−/− HS cells were cultured in the presence (KO) or absence (CT) of 4OHT. (A) Representative microphotographs of electron microscopy analyses showing the formation of autophagic vacuoles in E4F1 KO HS cells (top). Higher magnification (bottom) of the same cells (boxed areas) showing the apparition of double-membraned cytoplasmic vacuoles containing dark degradation products in E4F1 KO HS cells (white arrows). (B) Quantitative immunoblot analyses of conversion of LC3-I to LC3-II upon E4F1 inactivation in HS cells. Treatment with the autophagy inhibitor 3MA is indicated. Actin was used as a loading control. Top panels show representative immunoblots. The bottom panel represents the quantitative analyses of LC3-II levels normalized to actin levels (mean ± SD; n = 3; *, P < 0.05; **, P < 0.01; ***, P < 0.001). (C) Representative microphotograph of HS cells stained with anti-LC3 antibody and DAPI and visualized by fluorescence microscopy. (D) Formation of acidic vesicular organelles in HS cells was visualized by fluorescence microscopy after staining with the lysosomal-specific dye AO and DAPI. (E) Percentage of annexin V–positive HS cells was measured by flow cytometry (mean ± SD; n = 3). Cells were treated with 3MA where indicated. Bars: (A) 500 nm; (C and D) 10 µm.
Figure 6.
Figure 6.
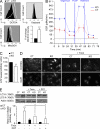
E4F1 inactivation results in mitochondrial defects and increased ROS levels. E4F1−/flox; RERTKI/KI; Ink4a/Arf−/− HS cells were cultured in the presence (KO) or absence (CT) of 4OHT. (A) Flow cytometry analyses of ROS levels measured by DCFDA, OxyBURST, and the mitochondria-specific MitoSOX probes in E4F1 CT and KO HS cells, as indicated. Bar graph represents quantitative data showing fold increase of time-dependent changes in mean fluorescence intensity of MitoSOX measured by flow cytometry (mean ± SD; n = 3; ***, P < 0.001). (B) Mitochondrial OCR corresponding to basal respiration, oligomycin-sensitive OCR, and maximal respiration (evaluated upon injection with the uncoupling agent FCCP followed by the inhibitor of the mitochondrial complex I rotenone) in HS cells, as indicated. Values were normalized to total protein levels. Vertical bars indicate the time of injection of the indicated compound. Data are represented as the mean ± SD of triplicate experiments. (C) Total ATP levels in E4F1 CT and KO HS cells were measured 3 d after 4OHT addition (mean ± SD; n = 3; **, P < 0.01). (D) Genomic DNA oxidation was measured in HS cells by fluorescent microscopy using a direct binding assay based on avidin-conjugated FITC that binds 8-OHdG, in the presence or absence of the superoxide anion scavenger Tiron. Representative images of three independent experiments are shown. Bars, 10 µm. (E) Quantitative immunoblot analyses of LC3 expression in total protein extracts prepared from E4F1 CT and KO HS cells treated with vehicle, Tiron, or D3T, an inducer of cellular antioxidant defenses, as indicated. LC3-II levels were normalized to actin levels (mean ± SD; n = 3; *, P < 0.05; ***, P < 0.001).
Figure 7.
Figure 7.
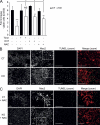
ROS scavengers rescue cell death occurring in E4F1 KO HS cells. (A) E4F1−/flox; RERTKI/KI; Ink4a/Arf−/− HS cells were cultured in the presence (KO) or absence (CT) of 4OHT. Number of viable cells assessed in the absence or presence of the ROS scavengers Tiron or NAC or upon the addition of D3T in E4F1 KO or CT HS cells, as indicated. Bar graph represents quantitative analysis showing fold increase of viable HS cells between days 0 (DO) and 3 (D3) after 4OHT treatment (mean ± SD; n = 3; *, P < 0.05; **, P < 0.01; ***, P < 0.001). (B and C) Representative microphotographs of TUNEL staining performed on liver tissue sections prepared from vehicle (B)- or NAC (C)-treated E4F1+/flox; RERTKI/KI; Ink4a/Arf−/− (CT) or E4F1−/flox; RERTKI/KI; Ink4a/Arf−/− (KO) mice 15 d after 4OHT administration. Sections were colabeled with TUNEL, Mac2, and DAPI as indicated. Merge images (Mac2, red; TUNEL, green) are shown at higher magnification (boxed areas). Bars, 50 µm.
Figure 8.
Figure 8.
E4F1 inactivation does not result in mitochondrial defects, increased ROS levels, or increased cell death in normal primary macrophages. Primary macrophages were purified from the intraperitoneal cavity of age-matched E4F1+/flox; RERTKI/KI or E4F1−/flox; RERTKI/KI animals. E4F1 inactivation was induced ex vivo by the addition of 4OHT in the culture medium. Analyses were performed between 4 and 5 d after 4OHT addition. (A) Immunoblot analysis of E4F1 expression in E4F1+/flox or E4F1−/flox primary macrophages. GAPDH was used as a loading control. (B) Flow cytometry analysis of intracellular ROS levels (DCFDA) in E4F1 E4F1+/flox or E4F1−/flox primary macrophages. (C) Primary macrophages were stained with annexin V and analyzed by flow cytometry. (D) OCRs of E4F1+/flox or E4F1−/flox primary macrophages were measured as described in Fig. 6. Vertical bars indicate the time of injection of the indicated compound. Data are represented as the mean ± SD of triplicate experiments.
Figure 9.
Figure 9.
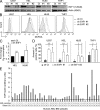
E4F1 is overexpressed in human AML samples, and its depletion induces mitochondrial defects, increased ROS levels, and cell death in human myeloid leukemic cell lines. (A) Immunoblot analysis of E4F1 expression in human HS U937, erythroleukemic HEL, promyelocytic leukemia HL60, and acute monocytic leukemia THP1 cell lines transduced with lentiviruses encoding two independent shRNAs (#1 and #2) directed against human E4F1 or a control irrelevant shRNA (Ct). (B) Representative flow cytometry analyses of ROS levels (DFCDA) in U937, HEL, HL60, and THP1 cell lines treated with Ct or E4F1 shRNA. (C) O2 consumption in human HEL and HL60 myeloid leukemic cell lines upon treatment with Ct or E4F1 shRNA, as indicated. O2 consumption was measured using a Clark-type O2 electrode chamber. Bar graph represents the mean ± SD (n = 3; *, P < 0.05; ***, P < 0.001). (D) Flow cytometry analyses of annexin V–positive cells in human myeloid leukemic cell lines treated with Ct or E4F1 shRNAs (#1 and #2), as indicated. Bar graph represents the mean ± SD (n = 3; *, P < 0.05; ***, P < 0.001). (E) E4F1 and actin (loading control) protein expression levels were evaluated by quantitative immunoblotting on total protein extracts prepared from BM samples from adult AML patients. Bar graph represents the ratio between E4F1 and actin protein levels of individual patients. The dotted line represents the mean value of this ratio obtained with three normal BM samples. The percentage of myeloid leukemic blasts in each sample was evaluated to avoid potential bias based on heterogeneity of the AML BM samples tested.

References

    1. Ahmed-Choudhury J., Agathanggelou A., Fenton S.L., Ricketts C., Clark G.J., Maher E.R., Latif F. 2005. Transcriptional regulation of cyclin A2 by RASSF1A through the enhanced binding of p120E4F to the cyclin A2 promoter. Cancer Res. 65:2690–2697 10.1158/0008-5472.CAN-04-3593 - DOI - PubMed
    1. Berger J.H., Bardeesy N. 2007. Modeling INK4/ARF tumor suppression in the mouse. Curr. Mol. Med. 7:63–75 10.2174/156652407779940477 - DOI - PubMed
    1. Carrasco D.R., Fenton T., Sukhdeo K., Protopopova M., Enos M., You M.J., Di Vizio D., Nogueira C., Stommel J., Pinkus G.S., et al. 2006. The PTEN and INK4A/ARF tumor suppressors maintain myelolymphoid homeostasis and cooperate to constrain histiocytic sarcoma development in humans. Cancer Cell. 9:379–390 10.1016/j.ccr.2006.03.028 - DOI - PubMed
    1. Chagraoui J., Niessen S.L., Lessard J., Girard S., Coulombe P., Sauvageau M., Meloche S., Sauvageau G. 2006. E4F1: a novel candidate factor for mediating BMI1 function in primitive hematopoietic cells. Genes Dev. 20:2110–2120 10.1101/gad.1453406 - DOI - PMC - PubMed
    1. Colombo R., Draetta G.F., Chiocca S. 2003. Modulation of p120E4F transcriptional activity by the Gam1 adenoviral early protein. Oncogene. 22:2541–2547 10.1038/sj.onc.1206379 - DOI - PubMed

Publication types

MeSH terms