. 2011 Jul 4;208(7):1447-57.
doi: 10.1084/jem.20102665. Epub 2011 Jun 27.

CIN85 drives B cell responses by linking BCR signals to the canonical NF-kappaB pathway

Affiliations

CIN85 drives B cell responses by linking BCR signals to the canonical NF-kappaB pathway

Kohei Kometani et al. J Exp Med. .

Abstract

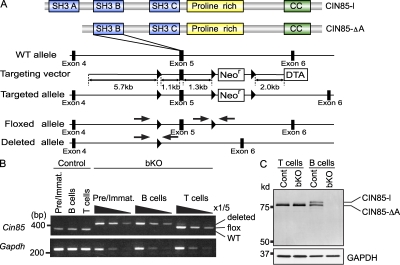
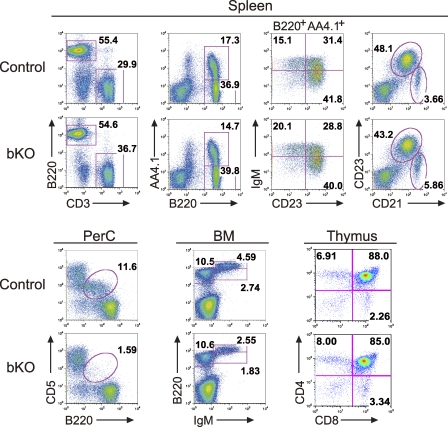
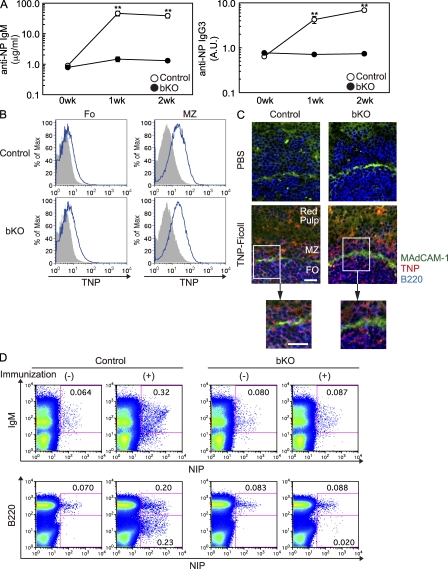
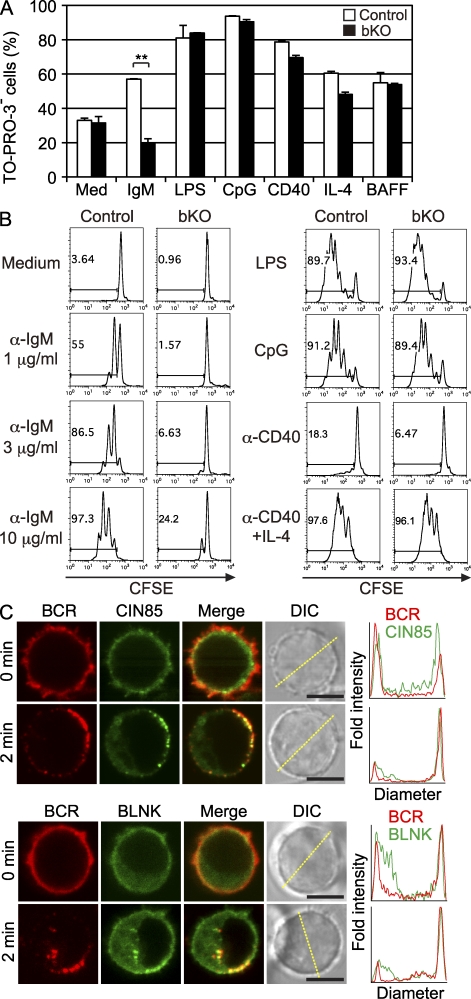
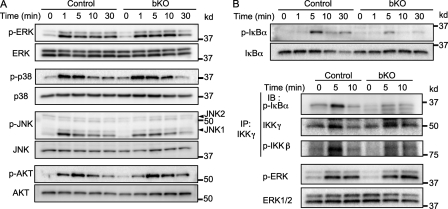
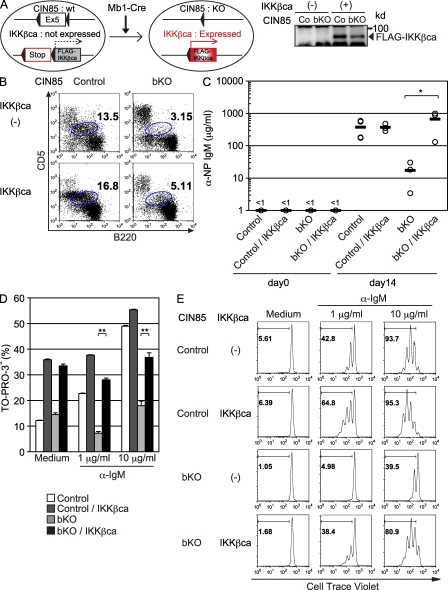
CIN85, an adaptor protein which binds the C-terminal domain of tyrosine phosphorylated Cbl and Cbl-b, has been thought to be involved in the internalization and subsequent degradation of receptors. However, its physiological function remains unclear. To determine its role in B cells, we used Mb1-cre to generate mice with a B cell-specific deletion of CIN85. These mice had impaired T cell-independent type II antibody responses in vivo and diminished IKK-β activation and cellular responses to B cell receptor (BCR) cross-linking in vitro. Introduction of a constitutively active IKK-β construct corrected the defective antibody responses as well as cellular responses in the mutant mice. Together, our results suggest that CIN85 links the BCR to IKK-β activation, thereby contributing to T cell-independent immune responses.


Figures

Figure 1.
Figure 1.
Generation of CIN85 bKO mice. (A) CIN85-l and CIN85-ΔA contain three or two SH3 domains, respectively. Both isoforms contain a proline-rich region and a coiled-coil (CC) domain. A schematic of CIN85 WT and floxed allele is shown. Exon 5 is flanked by two loxP sites. Arrows indicate primer position for PCR. (B) BM pre–B cells and immature B cells (Pre/Immat.) or spleen B cells or T cells from mb1-Cre; CIN85wt/Y (control) or mb1-Cre; CIN85fl/Y (CIN85 bKO) mice were sorted. CIN85 is located on the X chromosome and Y indicates Y chromosome. DNA was extracted from sorted cells and the deletion efficiency was assayed by PCR. The template DNA was serially diluted. (C) Inactivation of the CIN85 was confirmed by Western blotting in spleen B cells and T cells. Migration of molecular mass markers is shown on the left side. The membrane was stripped and reprobed with anti-GAPDH antibody. Representative data of three independent experiments are shown.
Figure 2.
Figure 2.
B-1a cells in the peritoneal cavity are reduced in CIN85 bKO mice. B and T cell development in the BM, spleen, thymus, and peritoneal cavity (PerC) of control and CIN85 bKO mice were analyzed by flow cytometry. Numbers represent the percentages of cells within the gates. Representative data of seven independent experiments are shown.
Figure 3.
Figure 3.
TI-II but not TD responses are impaired in CIN85 bKO mice. (A) Control or CIN85 bKO mice were injected i.p. with 50 µg NP-Ficoll. Sera from each mouse were collected before and every week after the immunization and the titers of anti-NP IgM (micrograms per milliliter) and IgG3 (arbitrary units [A.U.]) were measured by ELISA. Results are shown as the mean ± SD. **, P < 0.01. Each group consisted of at least four mice and the representative data of three repeated experiments are shown. (B and C) Mice were injected i.v. with PBS or 100 µg TNP-Ficoll. After 30 min, spleens were collected and TNP-binding B cells were analyzed by flow cytometry (B) or immunohistochemistry (C). In the flow cytometric analysis, FO B cells and MZ B cells were defined as CD21loCD23hi and CD21hiCD23lo cells, respectively. The gray histogram represents PBS-injected control mice. Frozen sections were stained with anti–MAdCAM-1 (green), TNP (red), and B220 (blue) antibodies. Bars, 20 µm. (D) Spleen cells were collected from control or CIN85 bKO mice 4 d after the i.p. injection with or without NP-Ficoll and analyzed by flow cytometry. NP-binding B cells were detected by staining with NIP-BSA-PE as described in the Materials and methods. Representative data of at least two independent experiments are shown (B–D).
Figure 4.
Figure 4.
BCR-induced proliferation and survival in vitro are impaired in CIN85 bKO mice. (A) Spleen B cells from each mouse were negatively purified with anti-CD43 magnetic beads and were cultured with 10 µg/ml anti-IgM F(ab’)2 fragment, 10 µg/ml LPS, 100 nM CpG, 2 µg/ml anti-CD40 antibody, 10 ng/ml IL-4, or 50 ng/ml BAFF. After 48 h of culture, the proportion of live cells was enumerated as percentage of TO-PRO-3–excluding cells. Results represent the mean ± SD. n = 3. **, P < 0.01. (B) Purified spleen B cells were labeled with 5 µM CFSE. These CFSE-labeled cells were then cultured with 1, 3, or 10 µg/ml anti-IgM F(ab’)2 fragment, LPS, CpG, anti-CD40 antibody, or anti-CD40 plus IL-4 as indicated. After the culture for 72 h, cell division was measured by flow cytometry. Representative data from three independent experiments are shown (A and B). (C) Purified spleen B cells were stimulated with LPS for 1 d, and cells were transduced with retroviruses encoding CIN85-GFP or BLNK-YFP. 2 d after the infection, microscopic analysis was performed. Top, CIN85 bKO B cells expressing CIN85-GFP (green) were stained by rat anti-IgM antibody (red), fixed before (top) or 2 min after (bottom) cross-linking by anti–rat IgG antibody, and imaged by confocal microscopy. Histograms show fold fluorescent intensities of BCR (red) and CIN85-GFP (green) measured on the diagonal yellow line shown in the DIC images. Bars, 5 µm. Bottom, splenic B cells expressing BLNK-YFP (green) were stained by rat anti-IgM antibody (red), fixed before (top) or 2 min after (bottom) cross-linking by anti–rat IgG antibody, and imaged by confocal microscopy. More than 70% of BCR clusters were colocalized by BLNK or CIN85 on the cell surface (BLNK, 74.9 ± 11.6%; CIN85, 71.9 ± 19.9%; n = 20). Histograms show fold fluorescent intensities of BCR (red) and BLNK-YFP (green) measured on the diagonal yellow line shown in the DIC images. Bars, 5 µm. n = 50.
Figure 5.
Figure 5.
BCR-dependent activation of the canonical NF-κB pathway is impaired in CIN85 bKO B cells. (A) Purified spleen B cells were stimulated with 10 µg/ml anti-IgM F(ab’)2 for indicated times (minutes). The cells were lysed and subjected to SDS-PAGE. Transferred membranes were probed with the indicated antibodies. (B) Spleen B cells from control or CIN85 bKO mice were stimulated with 10 µg/ml anti-IgM F(ab’)2 fragment for the indicated times. After stimulation, some of the cells were subjected to SDS-PAGE to measure the phosphorylation status of IκBα (top). Other cells were collected, precipitated by anti–IKK-γ antibody and subjected to an IKK kinase assay using GST-IκBα as a substrate. The amount of phosphorylated GST-IκBα was detected by Western blotting as described in the Materials and methods (bottom). Phosphorylation status of IKK-β was also analyzed by Western blotting. p-ERK was examined with whole cell lysate. Representative data of at least three independent experiments are shown.
Figure 6.
Figure 6.
Impaired TI-II responses in CIN85 bKO mice are restored by introduction of constitutively active IKK-β. (A) Schematic design of the experiment. In the presence of Cre, exon 5 of Cin85 is deleted and Flag-IKK-βca is expressed. To confirm the expression of FLAG-tagged IKK-βca, spleen B cells from control (Co) and CIN85 bKO were subjected to Western blotting. (B) Peritoneal cells from control, CIN85 bKO, CIN85 control; R26IKKβcaKI/wt, and CIN85 bKO; R26IKKβcaKI/wt mice were analyzed by flow cytometry. Numbers indicate the percentages of B-1a cells within the gate. (C) 3 × 10⁶ purified spleen B cells from mice of indicated genotypes were injected i.v. into Rag1−/− mice. On the next day, 50 µg NP-Ficoll was injected i.p. Sera were collected 14 d later and the anti-NP IgM titer was measured by ELISA. Circles represent each titer and black bars represent the means. *, P < 0.05 (D) Purified spleen B cells from each genotype were cultured with medium alone or anti-IgM F(ab’)2 fragment for 48 h and the proportion of live cells were enumerated using TO-PRO-3. Data are shown as the mean ± SD. **, P < 0.01 (E) Spleen B cells of indicated genotypes were labeled with 5 µM CellTrace violet and cultured with medium alone or anti-IgM F(ab’)2 fragment for 72 h and fluorescence intensity was measured by flow cytometry. Each group consisted of three mice (B and C) and representative data of three independent experiments are shown (D and E).

Similar articles

Cited by

References

    1. Anderson S.M., Tomayko M.M., Ahuja A., Haberman A.M., Shlomchik M.J. 2007. New markers for murine memory B cells that define mutated and unmutated subsets. J. Exp. Med. 204:2103–2114 10.1084/jem.20062571 - DOI - PMC - PubMed
    1. Baba Y., Nishida K., Fujii Y., Hirano T., Hikida M., Kurosaki T. 2008. Essential function for the calcium sensor STIM1 in mast cell activation and anaphylactic responses. Nat. Immunol. 9:81–88 10.1038/ni1546 - DOI - PubMed
    1. Bezsonova I., Bruce M.C., Wiesner S., Lin H., Rotin D., Forman-Kay J.D. 2008. Interactions between the three CIN85 SH3 domains and ubiquitin: implications for CIN85 ubiquitination. Biochemistry. 47:8937–8949 10.1021/bi800439t - DOI - PubMed
    1. Bléry M., Tze L., Miosge L.A., Jun J.E., Goodnow C.C. 2006. Essential role of membrane cholesterol in accelerated BCR internalization and uncoupling from NF-κB in B cell clonal anergy. J. Exp. Med. 203:1773–1783 10.1084/jem.20060552 - DOI - PMC - PubMed
    1. Buchman V.L., Luke C., Borthwick E.B., Gout I., Ninkina N. 2002. Organization of the mouse Ruk locus and expression of isoforms in mouse tissues. Gene. 295:13–17 10.1016/S0378-1119(02)00821-1 - DOI - PubMed

Publication types

MeSH terms