

Time-dependent changes in membrane excitability during glucose-induced bursting activity in pancreatic β cells
- PMID: 21708954
- PMCID: PMC3137027
- DOI: 10.1085/jgp.201110612
Time-dependent changes in membrane excitability during glucose-induced bursting activity in pancreatic β cells
Abstract
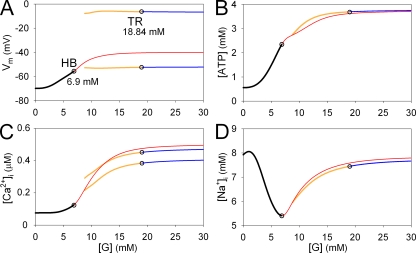
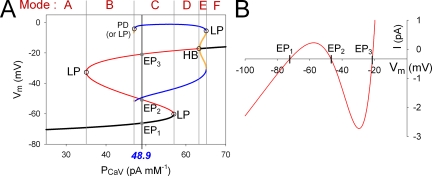
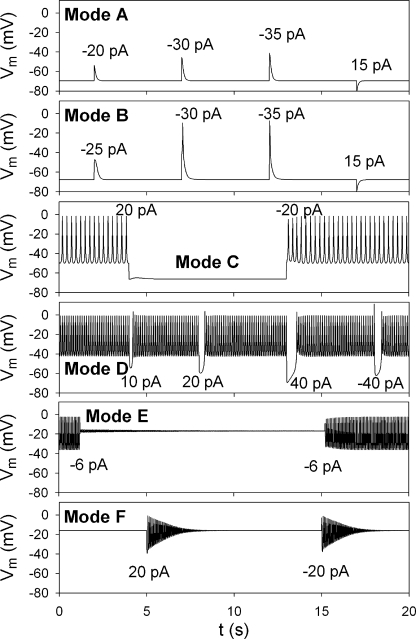
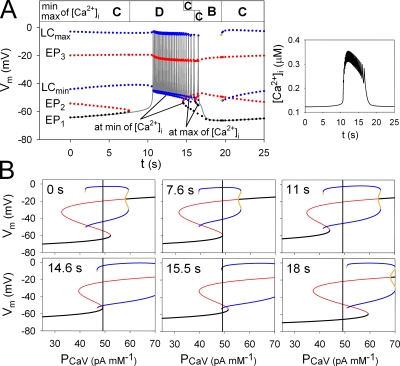
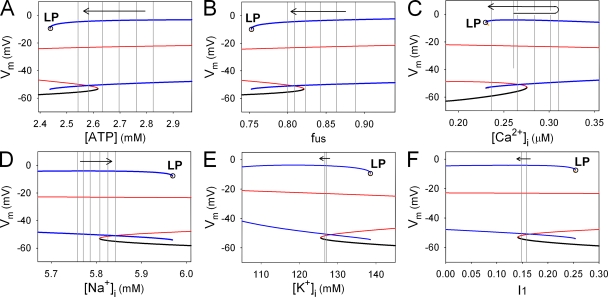
In our companion paper, the physiological functions of pancreatic β cells were analyzed with a new β-cell model by time-based integration of a set of differential equations that describe individual reaction steps or functional components based on experimental studies. In this study, we calculate steady-state solutions of these differential equations to obtain the limit cycles (LCs) as well as the equilibrium points (EPs) to make all of the time derivatives equal to zero. The sequential transitions from quiescence to burst-interburst oscillations and then to continuous firing with an increasing glucose concentration were defined objectively by the EPs or LCs for the whole set of equations. We also demonstrated that membrane excitability changed between the extremes of a single action potential mode and a stable firing mode during one cycle of bursting rhythm. Membrane excitability was determined by the EPs or LCs of the membrane subsystem, with the slow variables fixed at each time point. Details of the mode changes were expressed as functions of slowly changing variables, such as intracellular [ATP], [Ca(2+)], and [Na(+)]. In conclusion, using our model, we could suggest quantitatively the mutual interactions among multiple membrane and cytosolic factors occurring in pancreatic β cells.
Figures
Comment in
-
Dynamical systems theory in physiology.J Gen Physiol. 2011 Jul;138(1):13-9. doi: 10.1085/jgp.201110668. J Gen Physiol. 2011. PMID: 21708952 Free PMC article. No abstract available.
Similar articles
-
Ionic mechanisms and Ca2+ dynamics underlying the glucose response of pancreatic β cells: a simulation study.J Gen Physiol. 2011 Jul;138(1):21-37. doi: 10.1085/jgp.201110611. J Gen Physiol. 2011. PMID: 21708953 Free PMC article.
-
Mathematical simulation of membrane processes and metabolic fluxes of the pancreatic beta-cell.Bull Math Biol. 2006 Oct;68(7):1779-818. doi: 10.1007/s11538-005-9053-9. Epub 2006 Jul 11. Bull Math Biol. 2006. PMID: 16832733
-
[Theoretical Investigations into the Quantitative Mechanisms Underlying the Regulation of [cAMP]i, Membrane Excitability and [Ca(2+)]i during GLP-1 Stimulation in Pancreatic β Cells].Yakugaku Zasshi. 2016;136(3):467-71. doi: 10.1248/yakushi.15-00246-2. Yakugaku Zasshi. 2016. PMID: 26935088 Review. Japanese.
-
Rapid functional evaluation of beta-cells by extracellular recording of membrane potential oscillations with microelectrode arrays.Pflugers Arch. 2011 Dec;462(6):835-40. doi: 10.1007/s00424-011-1029-z. Epub 2011 Sep 24. Pflugers Arch. 2011. PMID: 21947556
-
Electrophysiology of islet cells.Adv Exp Med Biol. 2010;654:115-63. doi: 10.1007/978-90-481-3271-3_7. Adv Exp Med Biol. 2010. PMID: 20217497 Review.
Cited by
-
Mechanisms Underlying Spontaneous Action Potential Generation Induced by Catecholamine in Pulmonary Vein Cardiomyocytes: A Simulation Study.Int J Mol Sci. 2019 Jun 14;20(12):2913. doi: 10.3390/ijms20122913. Int J Mol Sci. 2019. PMID: 31207916 Free PMC article.
-
Ionic mechanisms and Ca2+ dynamics underlying the glucose response of pancreatic β cells: a simulation study.J Gen Physiol. 2011 Jul;138(1):21-37. doi: 10.1085/jgp.201110611. J Gen Physiol. 2011. PMID: 21708953 Free PMC article.
-
Mathematical models of electrical activity of the pancreatic β-cell: a physiological review.Islets. 2014;6(3):e949195. doi: 10.4161/19382014.2014.949195. Islets. 2014. PMID: 25322829 Free PMC article. Review.
-
Phase Analysis of Metabolic Oscillations and Membrane Potential in Pancreatic Islet β-Cells.Biophys J. 2016 Feb 2;110(3):691-699. doi: 10.1016/j.bpj.2015.12.029. Biophys J. 2016. PMID: 26840733 Free PMC article.
-
Phase transitions in the multi-cellular regulatory behavior of pancreatic islet excitability.PLoS Comput Biol. 2014 Sep 4;10(9):e1003819. doi: 10.1371/journal.pcbi.1003819. eCollection 2014 Sep. PLoS Comput Biol. 2014. PMID: 25188228 Free PMC article.
References
-
- Bertram R., Butte M.J., Kiemel T., Sherman A. 1995. Topological and phenomenological classification of bursting oscillations. Bull. Math. Biol. 57:413–439 - PubMed
Publication types
MeSH terms
Substances
LinkOut - more resources
Full Text Sources
Miscellaneous
