. 2011 Jun 27;193(7):1275-88.
doi: 10.1083/jcb.201009126.

Phosphoinositide 3-kinase signaling pathway mediated by p110α regulates invadopodia formation

Affiliations

Phosphoinositide 3-kinase signaling pathway mediated by p110α regulates invadopodia formation

Hideki Yamaguchi et al. J Cell Biol. .

Abstract

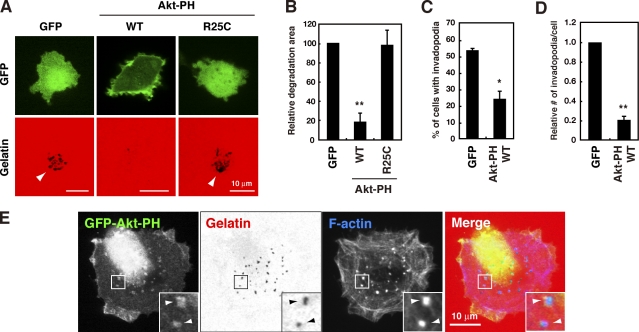
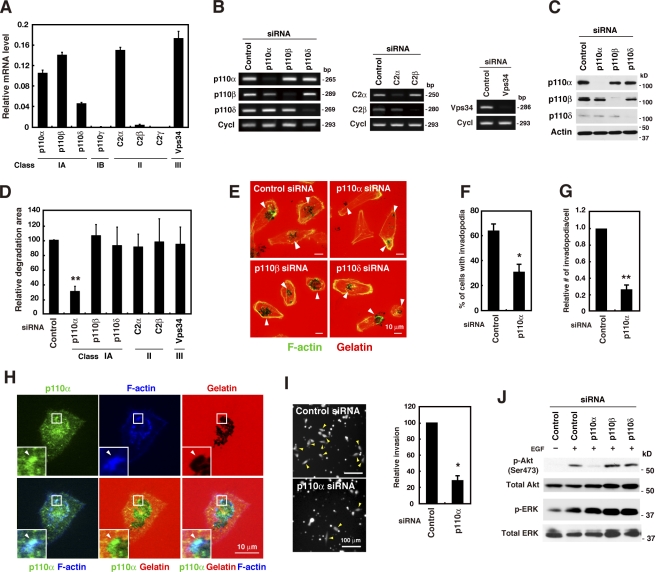
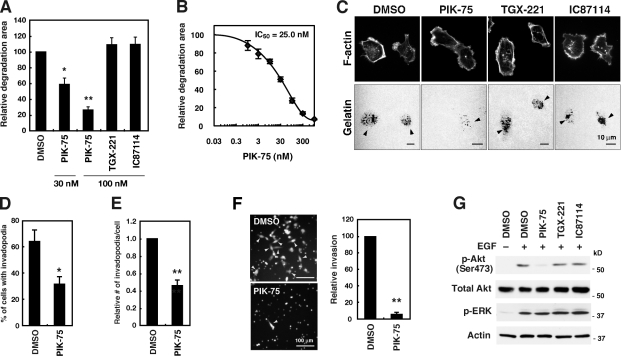
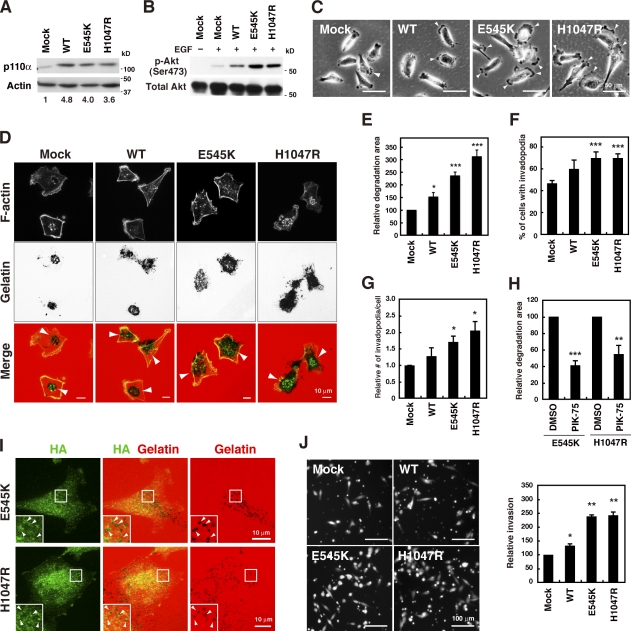
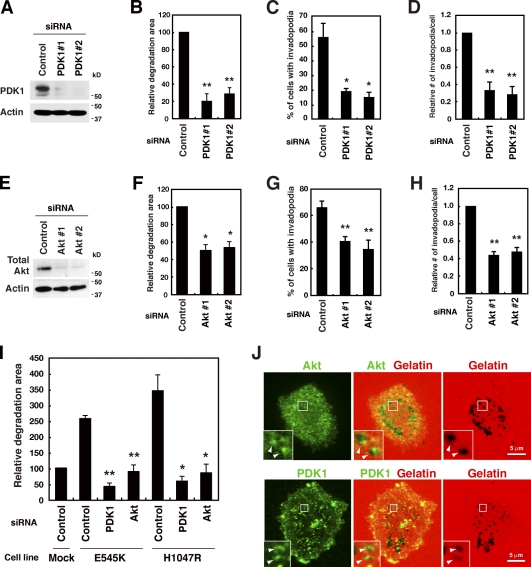
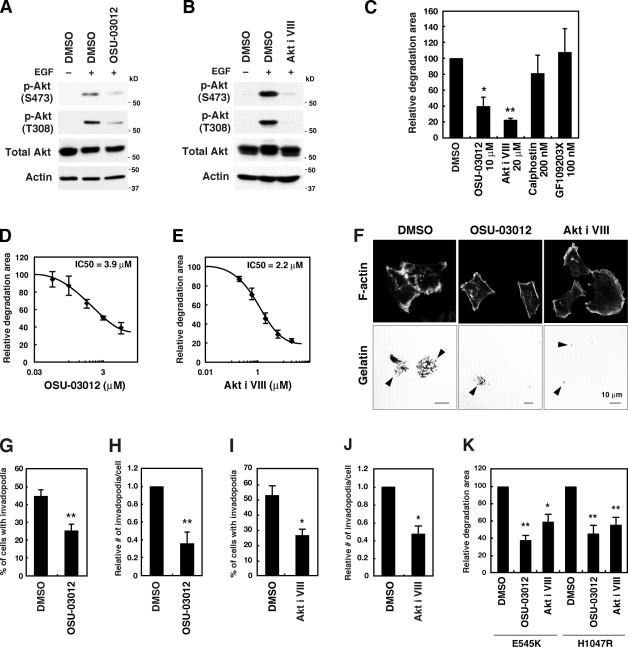
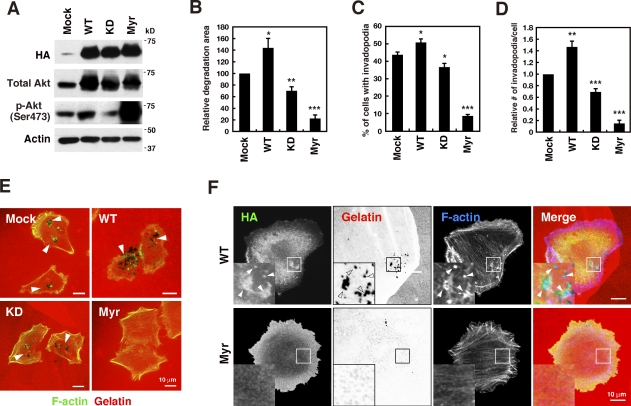
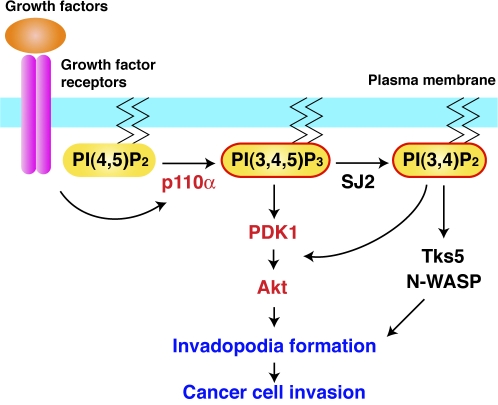
Invadopodia are extracellular matrix-degrading protrusions formed by invasive cancer cells that are thought to function in cancer invasion. Although many invadopodia components have been identified, signaling pathways that link extracellular stimuli to invadopodia formation remain largely unknown. We investigate the role of phosphoinositide 3-kinase (PI3K) signaling during invadopodia formation. We find that in human breast cancer cells, both invadopodia formation and degradation of a gelatin matrix were blocked by treatment with PI3K inhibitors or sequestration of D-3 phosphoinositides. Functional analyses revealed that among the PI3K family proteins, the class I PI3K catalytic subunit p110α, a frequently mutated gene product in human cancers, was selectively involved in invadopodia formation. The expression of p110α with cancerous mutations promoted invadopodia-mediated invasive activity. Furthermore, knockdown or inhibition of PDK1 and Akt, downstream effectors of PI3K signaling, suppressed invadopodia formation induced by p110α mutants. These data suggest that PI3K signaling via p110α regulates invadopodia-mediated invasion of breast cancer cells.


Figures

Figure 1.
Figure 1.
D-3 phosphoinositides are necessary for invadopodia formation. (A) MDA-MB-231 cells transfected with the GFP, GFP-Akt-PH wild-type (WT), or GFP-Akt-PH R25C mutant construct were cultured on fluorescent gelatin-coated coverslips for 7 h and imaged by confocal microscopy. Arrowheads denote degradation sites on the gelatin matrix. (B–D) Degraded areas on the gelatin matrix (B), the percentage of cells with invadopodia (C), and the relative number of invadopodia per cell (D) were quantified for transfected cells as described in the Materials and methods. (E) MDA-MB-231 cells stably expressing GFP-Akt-PH WT were cultured on fluorescent gelatin-coated coverslips for 3 h, stained for F-actin, and observed by confocal microscopy. Insets are magnified images of the boxed regions. Arrowheads denote invadopodia where GFP-Akt-PH signals were accumulated. Data in B–D are represented as means + SEM of four independent determinations. *, P < 0.01; and **, P < 0.005 by Student’s t test.
Figure 2.
Figure 2.
Class I PI3K catalytic subunit p110α is an essential regulator of invadopodia formation. (A) Real-time quantitative PCR analysis of the expression of PI3K isoforms in MDA-MB-231 cells. The relative mRNA levels of PI3K isoforms normalized with the mRNA levels of cyclophilin B are shown. (B and C) MDA-MB-231 cells were transfected with siRNAs targeting individual PI3K isoforms for 48 h, and the expression profiles of PI3K isoforms were determined by RT-PCR (B) and immunoblot analyses (C). Cyclophilin B (Cycl) and β-actin were used as internal controls. (D) MDA-MB-231 cells transfected with the indicated siRNAs were cultured on fluorescent gelatin-coated coverslips for 7 h, and the degraded areas on the gelatin matrix were quantified. (E) Representative images of cells transfected with siRNAs targeting p110 isoforms and stained for F-actin. Arrowheads denote the gelatin degradation sites. (F and G) The percentage of cells with invadopodia (F) and the relative number of invadopodia per cell (G) were determined in cells transfected with control or p110α siRNA. (H) MDA-MB-231 cells plated onto fluorescent gelatin-coated coverslips for 4 h were stained with anti-p110α antibody and phalloidin. Insets are magnified images of the boxed regions. Arrowheads denote accumulation of p110α signals at invadopodia. (I) MDA-MB-231 cells transfected with control or p110α siRNA were labeled with CellTracker green and analyzed for invasion through Matrigel-coated Transwell inserts for 24 h. Invaded cells were then imaged by fluorescent microscopy and counted. Arrowheads denote invaded cells. Smaller dots represent pores of the membrane of Transwell inserts. (J) MDA-MB-231 cells transfected with the indicated siRNAs were serum-starved overnight and stimulated with 8 nM EGF for 10 min. The cells were then analyzed by immunoblotting to determine the phosphorylation status of Akt (p-Akt) and ERK (p-ERK). Data are represented as means + SEM of three (A and I), eight (D), and five (F and G) independent determinations. *, P < 0.01; and **, P < 0.0002 by Student’s t test.
Figure 3.
Figure 3.
Effects of pharmacological inhibition of class I PI3Ks on invadopodia formation. (A) MDA-MB-231 cells were cultured on fluorescent gelatin-coated coverslips for 7 h in the presence or absence of various class I PI3K inhibitors, including PIK-75 for p110α, TGX-221 for p110β, and IC87114 for p110δ. The degraded areas on the gelatin matrix were quantified and are represented as the percentage of control DMSO-treated cells. (B) Dose–response curve of gelatin degradation obtained in the presence of increasing concentrations of PIK-75 is shown. (C) Representative images of MDA-MB-231 cells treated with various class I PI3K inhibitors are shown. Arrowheads denote the gelatin degradation sites. (D and E) The percentage of cells with invadopodia (D) and the relative number of invadopodia per cell (E) were determined in cells treated with control DMSO or 100 nM PIK-75. (F) MDA-MB-231 cells labeled with CellTracker green were analyzed for invasion through Matrigel-coated Transwell inserts in the presence or absence of 100 nM PIK-75 for 24 h. Invaded cells were then imaged by fluorescent microscopy and counted. Arrowheads denote invaded cells. (G) MDA-MB-231 cells were serum-starved overnight and treated with 300 nM of the indicated class I PI3K inhibitors for 1 h. The cells were subsequently stimulated with 8 nM EGF for 10 min and used for immunoblotting to determine the phosphorylation status of Akt (p-Akt) and ERK (p-ERK). Data are represented as means ± SEM of six (A, D, and E) and three (B and F) independent determinations. *, P < 0.01; and **, P < 0.0005 by Student’s t tests.
Figure 4.
Figure 4.
Cancerous p110α mutations promote invadopodia formation. (A) MDA-MB-231 cells stably expressing wild-type (WT), E545K, or H1047R p110α were analyzed by immunoblotting. Numbers below represent relative expression levels of the p110α constructs. (B) Cell lines stably expressing p110α were serum-starved overnight and stimulated with 8 nM EGF for 10 min. The phosphorylation status of Akt (p-Akt) was determined by immunoblotting. (C) Phase-contrast images show the morphology of the p110α cell lines. Arrowheads denote membrane protrusions. (D) Cells stably expressing the p110α constructs were cultured on fluorescent gelatin matrices for 7 h and stained with phalloidin to visualize invadopodia. Arrowheads denote the gelatin degradation sites. (E–G) Gelatin degradation activity (E), the percentage of cells with invadopodia (F), and the number of invadopodia per cell (G) were determined in p110α cell lines. (H) Cells expressing E545K or H1047R p110α were examined for gelatin degradation in the presence or absence of 100 nM PIK-75. (I) Cells expressing E545K or H1047R p110α were cultured on fluorescent gelatin matrices for 4 h and stained with anti-HA antibody to visualize localization of E545K and H1047R p110α. Insets are magnified images of the boxed regions. Arrowheads denote colocalization of the HA signals with the gelatin degradation sites. (J) Cells labeled with CellTracker green were analyzed for invasion through Matrigel-coated Transwell inserts for 24 h. Data are represented as means + SEM of seven (E), six (F–H), and three (J) independent determinations. *, P < 0.05; **, P < 0.01; and ***, P < 0.001 by Student’s t tests.
Figure 5.
Figure 5.
PDK1 and Akt are essential downstream effectors of p110α for invadopodia formation. (A) MDA-MB-231 cells were transfected with control or two distinct PDK1 siRNAs for 48 h and used for immunoblotting to determine the amount of PDK1. (B–D) Cells transfected with the control or PDK1 siRNA were cultured on fluorescent gelatin-coated coverslips for 7 h. Degraded areas on the gelatin matrix (B), the percentage of cells with invadopodia (C), and the number of invadopodia per cell (D) were quantified for transfected cells. (E) Cells were transfected with control or two different sets of siRNAs targeting Akt1, 2, and 3 for 48 h and used for immunoblotting analysis with the anti–pan-Akt antibody. (F–H) Degraded areas on the gelatin matrix (F), the percentage of cells with invadopodia (G), and the number of invadopodia per cell (H) were quantified for siRNA-transfected cells. (I) Cells stably expressing E545K or H1047R p110α were transfected with indicated siRNAs for 48 h and tested for invadopodia activities for 7 h. (J) MDA-MB-231 cells plated onto fluorescent gelatin-coated coverslips for 4 h were stained with the anti-Akt or anti-PDK1 antibody. Insets are magnified images of the boxed regions. Arrowheads denote the accumulation of Akt and PDK1 signals at the gelatin degradation sites. Data are represented as means + SEM of six (B, G, and H), four (C, D, and I), and three (F) independent determinations. *, P < 0.02; and **, P < 0.005 by Student’s t tests.
Figure 6.
Figure 6.
Pharmacological inhibition of PDK1 and Akt blocks invadopodia formation. (A and B) MDA-MB-231 cells were serum-starved overnight and treated with inhibitors, 10 µM OSU-03012 for PDK1 (A) or 20 µM Akt inhibitor VIII (Akt i VIII) for Akt (B) for 1 h. The cells were subsequently stimulated with 8 nM EGF for 10 min and used for immunoblotting to determine the phosphorylation status of Akt (p-Akt). (C) MDA-MB-231 cells were cultured on fluorescent gelatin-coated coverslips for 7 h in the presence of various inhibitors, including OSU-03012, Akt inhibitor VIII, and calphostin, and GF109203X for PKC. The degraded areas on the gelatin matrix were quantified. (D and E) Dose–response curves of gelatin degradation obtained in the presence of increasing concentrations of OSU-03012 (D) or Akt inhibitor VIII (E) are shown. (F) Representative images of MDA-MB-231 cells treated with 10 µM OSU-03012 and 20 µM Akt inhibitor VIII are shown. Arrowheads denote the gelatin degradation sites. (G–J) The percentage of cells with invadopodia (G and I) and the relative number of invadopodia per cell (H and J) were quantified for cells treated with 10 µM OSU-03012 (G and H) or 20 µM Akt inhibitor VIII (I and J). (K) Cells expressing E545K or H1047R p110α were examined for gelatin degradation in the presence of 10 µM OSU-03012 or 20 µM Akt inhibitor VIII. Data are represented as means ± SEM of six (C, I, and J), four (E, G, H, and K), and three (D) independent determinations. *, P < 0.02; and **, P < 0.005 by Student’s t tests.
Figure 7.
Figure 7.
Expression of Akt constructs affects invadopodia formation. (A) MDA-MB-231 cells stably expressing HA-tagged wild-type (WT), kinase-dead (KD), or myristoylated constitutively active (Myr) Akt1 were analyzed by immunoblotting. (B–D) Cells stably expressing the Akt constructs were cultured on fluorescent gelatin-coated coverslips for 7 h and stained for F-actin. Degraded areas on the gelatin matrix (B), the percentage of cells with invadopodia (C), and the number of invadopodia per cell (D) were quantified. Data are represented as means +SEM of six (B) and four to eight (C and D) independent determinations. *, P < 0.05; **, P < 0.01; and ***, P < 0.001 by Student’s t tests. (E) Representative images of cells expressing the Akt constructs. Arrowheads denote the gelatin degradation sites. (F) Cells expressing WT or Myr Akt1 were cultured on fluorescent gelatin matrices for 3 h and stained with anti-HA antibody and phalloidin. Insets are magnified images of the boxed regions. Arrowheads denote localization of the HA signals at invadopodia.
Figure 8.
Figure 8.
A model of the function of PI3K signaling in invadopodia formation and cell invasion. p110α that is activated downstream of growth factor receptors produces the signaling lipid PI(3,4,5)P3 to regulate invadopodia formation and cancer cell invasion. PI(3,4)P2 that is generated via dephosphorylation of PI(3,4,5)P3 by synaptojanin-2 (SJ2) may regulate invadopodia formation through the Tks5/N-WASP axis in parallel with PI(3,4,5)P3. PDK1 and Akt are activated by both PI(3,4,5)P3 and PI(3,4)P2 and act as mediators of the PI3K signaling pathway for invadopodia formation.

Similar articles

Cited by

References

    1. Aoki M., Batista O., Bellacosa A., Tsichlis P., Vogt P.K. 1998. The akt kinase: molecular determinants of oncogenicity. Proc. Natl. Acad. Sci. USA. 95:14950–14955 10.1073/pnas.95.25.14950 - DOI - PMC - PubMed
    1. Artym V.V., Zhang Y., Seillier-Moiseiwitsch F., Yamada K.M., Mueller S.C. 2006. Dynamic interactions of cortactin and membrane type 1 matrix metalloproteinase at invadopodia: defining the stages of invadopodia formation and function. Cancer Res. 66:3034–3043 10.1158/0008-5472.CAN-05-2177 - DOI - PubMed
    1. Barnett S.F., Defeo-Jones D., Fu S., Hancock P.J., Haskell K.M., Jones R.E., Kahana J.A., Kral A.M., Leander K., Lee L.L., et al. 2005. Identification and characterization of pleckstrin-homology-domain-dependent and isoenzyme-specific Akt inhibitors. Biochem. J. 385:399–408 10.1042/BJ20041140 - DOI - PMC - PubMed
    1. Bowden E.T., Coopman P.J., Mueller S.C. 2001. Invadopodia: unique methods for measurement of extracellular matrix degradation in vitro. Methods Cell Biol. 63:613–627 10.1016/S0091-679X(01)63033-4 - DOI - PubMed
    1. Buccione R., Caldieri G., Ayala I. 2009. Invadopodia: specialized tumor cell structures for the focal degradation of the extracellular matrix. Cancer Metastasis Rev. 28:137–149 10.1007/s10555-008-9176-1 - DOI - PubMed

Publication types

MeSH terms

Substances