. 2011 Jun 27;193(7):1289-303.
doi: 10.1083/jcb.201010059.

Pak1 regulates focal adhesion strength, myosin IIA distribution, and actin dynamics to optimize cell migration

Affiliations

Pak1 regulates focal adhesion strength, myosin IIA distribution, and actin dynamics to optimize cell migration

Violaine D Delorme-Walker et al. J Cell Biol. .

Abstract

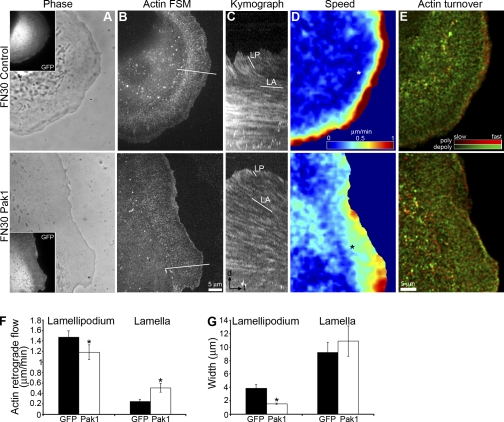
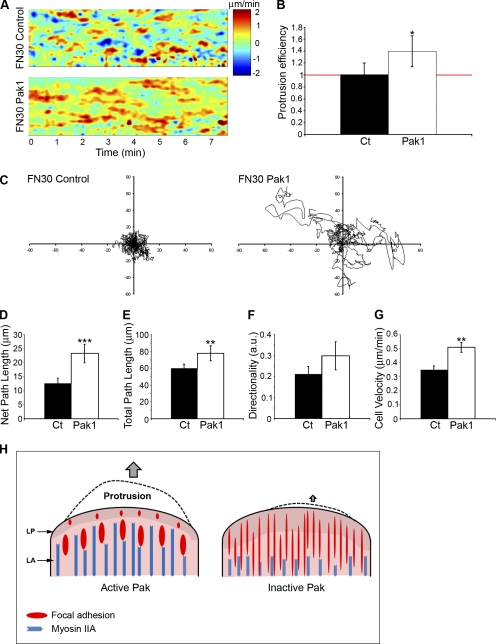
Cell motility requires the spatial and temporal coordination of forces in the actomyosin cytoskeleton with extracellular adhesion. The biochemical mechanism that coordinates filamentous actin (F-actin) assembly, myosin contractility, adhesion dynamics, and motility to maintain the balance between adhesion and contraction remains unknown. In this paper, we show that p21-activated kinases (Paks), downstream effectors of the small guanosine triphosphatases Rac and Cdc42, biochemically couple leading-edge actin dynamics to focal adhesion (FA) dynamics. Quantitative live cell microscopy assays revealed that the inhibition of Paks abolished F-actin flow in the lamella, displaced myosin IIA from the cell edge, and decreased FA turnover. We show that, by controlling the dynamics of these three systems, Paks regulate the protrusive activity and migration of epithelial cells. Furthermore, we found that expressing Pak1 was sufficient to overcome the inhibitory effects of excess adhesion strength on cell motility. These findings establish Paks as critical molecules coordinating cytoskeletal systems for efficient cell migration.


Figures

Figure 1.
Figure 1.
Pak inhibition decreases F-actin flow and turnover in the lamella. (A and B) Phase-contrast (A) and FSM images of X-rhodamine actin (B) in motile PtK1 cells expressing PID WT or an inactive mutant of the PID (PID L107F, used as a control). Insets show GFP expression of the GFP–PID WT or GFP–PID L107F constructs. (C) Kymographs taken from lines oriented along the axis of F-actin flow (indicated in B). Lines in C highlight the F-actin flow rates in the lamellipodium (LP) and the lamella (LA). Time bar (t), 2 min; Bar (d), 2 µm. (D) qFSM kinematic maps of the speed of F-actin flow. Note the slower flow in the lamella of the cell treated with PID (white asterisk) compared with the control cell (black asterisk). (E) qFSM kinetic maps of F-actin polymerization (red) and depolymerization (green) rates. Brightness indicates relative rate magnitude. (F) Average rates of F-actin retrograde flow in the lamellipodium and the lamella of Pak-inhibited cells (expressing PID) and control (Ct) cells (expressing an inactive mutant of PID, PID L107F) ± SEM. Pak inhibition significantly increased F-actin flow in the lamellipodium, whereas it significantly decreased the flow in the lamella. *, P < 0.0001 versus control cells; Student’s t test. (G) Average width of cellular regions measured from kymographs ± SEM. **, P = 0.0008; Student’s t test. (F and G) n ≥ 11 cells for each condition, with a minimum of 125 measurements per condition.
Figure 2.
Figure 2.
Pak inhibition displaces myosin IIA from the leading edge. (A) MHC immunofluorescence (green) and F-actin phalloidin staining (red) in migrating PtK1 expressing PID or an inactive mutant of the PID (PID L107F, noted control). Red lines in the MHC column indicate the leading edge of the cells as determined by the F-actin staining. White boxes in the merge column indicate the positions of insets for higher magnifications shown in the rightmost column. (B) Quantification of fluorescence intensity of MHC and F-actin for each indicated condition, measured from the cell edge (0 µm) into the cell center (10 µm). The data shown represent one experiment and are averaged from n ≥ 14 cells for each condition. The experiment was repeated at least three times with similar results. The arrows indicate the MHC-depleted zone from the cell edge. MHC was depleted in the first 2 µm in control cells, a distance corresponding to the size of the lamellipodium, whereas it was absent from at least 5 µm in Pak-inhibited cells.
Figure 3.
Figure 3.
Pak inhibition affects the organization and dynamics of paxillin in FAs. (A) Paxillin immunofluorescence imaged by TIRF microscopy in migrating PtK1 cells expressing PID WT or an inactive mutant of the PID (PID L107F, noted control). Insets show GFP expression of the GFP–PID WT or GFP–PID L107F constructs. White boxes in the paxillin column indicate the positions of insets for higher magnifications shown in the right column. (B–D) Quantification of paxillin fluorescence intensity in the protrusion (B), the average adhesion area in the protrusion (C), and the percentage of ventral cell area containing paxillin (D) for each condition ± SEM. *, P < 1.10−6 compared with control (Ct) cells; Student’s t test. a.u., arbitrary units. (E) Frequency histogram of paxillin foci length for each condition ± SEM. Numbers at the top right are the average lengths of the adhesion sites ± SEM. For quantifications in B–E, the experiment was repeated at least three times with n ≥ 30 cells for each condition, and all detectable FAs were quantified in each cell (corresponding to a minimum of 30 FAs per cell). (F and G) Example of GFP-paxillin fluorescence time-lapse images imaged by TIRF microscopy in PtK1 cells expressing GFP-paxillin alone (noted as a control; F) or in combination with PID (G). White boxes in the whole area images (left) indicate the localization of the magnified regions shown in the right panels. Elapsed time in minutes is shown. Arrowheads and arrows indicate assembling and disassembling FAs, respectively. Note that FAs in Pak-inhibited cells (G) were sparsely stained and assembled/disassembled slower than those in control cells (F). (H) Average rate constants of FA assembly and disassembly measured from 8–15 FAs per cell ± SEM, and n ≥ 7 cells per condition. *, P < 1.10−5 compared with control cells; Student’s t test. (I) Average FA lifetime measured from the initiation of a new GFP-paxillin cluster to complete disappearance (± SEM). *, P < 1.10−6 compared with PID-expressing cells. FAs in PID-expressing cells never disassembled during the 30 min of imaging.
Figure 4.
Figure 4.
Pak depletion affects FA distribution. (A) Immunoblot of Pak1 and Pak2 in U2OS cells transfected for 72 h with control (noted as Ct) siRNA or with siRNAs targeting Pak1 and Pak2 (noted as Pak). The actin immunoblot was used as a loading control. (B) Immunofluorescence of paxillin and F-actin staining in U2OS cells transfected for 72 h with control siRNA (noted as Ct siRNA) or siRNAs targeting Pak1 and Pak2 (noted Pak siRNA). White boxes in the paxillin column indicate the positions of insets for higher magnifications shown in the right column. (C–E) Quantification of paxillin fluorescence intensity in the protrusion (C), the average adhesion area in the protrusion (D), and the percentage of ventral cell area containing paxillin (E) for each siRNA condition ± SEM. *, P < 1.10−6 compared with control siRNA; Student’s t test. a.u., arbitrary units. (F) Frequency histograms of paxillin foci length for control cells or cells depleted in Pak (± SEM). The numbers at the top right are the average lengths of the adhesion sites ± SEM. For quantifications in C–F, the experiment was repeated at least three times with n ≥ 30 cells for each condition, and all detectable FAs were quantified in each cell (corresponding to a minimum of 30 FAs per cell).
Figure 5.
Figure 5.
Pak inhibition decreases cell migration and protrusiveness. (A) Activity maps of cell edge movement over time in migrating PtK1 cells expressing PID or an inactive mutant of the PID (PID L107F, noted as control). Edge displacements are encoded with warm color (red) for protrusion and cold color (blue) for retraction. (B) Average protrusion efficiency ± SEM. A protrusion efficiency value >1, represented by the red line, indicates a net advancement of the entire leading edge. Pak-inhibited cells did not protrude efficiently (P = 0.95 for PID-expressing cells). n ≥ 7 cells for each condition. *, P < 0.05 compared with a protrusion efficiency of 1. (C) Individual tracks of 15 cells expressing PID L107F as a control or PID WT transposed to a common origin. Pak inhibition led to shorter migration paths. (D–G) Quantification of motility parameters in C, including net path length (D), the net distance that the cells traversed from the first to the last frame; total path length (E), the total distance traversed by cells over time; directionality (F), the ratio of net to total path length; and cell velocity (G). The experiment was repeated at least four times, and n ≥ 30 cells analyzed for each condition. **, P < 0.01; ***, P = 0.0001 compared with control (Ct) cells. a.u., arbitrary units.
Figure 6.
Figure 6.
Pak activity is regulated by adhesion strength. (A) Cell lysates from PtK1 cells plated on low (5 µg/ml, FN5), medium (10 µg/ml, FN10), or high (30 µg/ml, FN30) FN concentrations were analyzed by immunoblotting and probed with phospho-specific antibodies anti-Pak1/Pak2 (active Pak1/Pak2) and antibodies to total proteins anti-Pak1/Pak2 and anti-actin. Two exposure times of the same immunoblot are shown: long (2-min exposition) and short (15-s exposition). Quantification of immunoblots was determined by the ratio of phosphorylated to total Pak1/Pak2 and was normalized to the FN10 condition, which correlates with optimal cell migration. The values shown are averages of three independent experiments. (B) Immunofluorescence with antibody directed against active Paks (pPak), paxillin, and F-actin phalloidin staining in PtK1 cells plated on FN5, FN10, and FN30. White boxes in the merge column indicate the positions of insets for higher magnifications shown in the rightmost column. (C) Frequency histogram of pPak fluorescence intensity in FAs for each FN concentration (low FN5, medium FN10, and high FN30). The numbers at the top right are the average pPak intensities ± SD. The data shown are representative of one experiment and are averaged from n ≥ 30 cells for each condition. The experiment was repeated three times with similar results. All detectable FAs were quantified in each cell (corresponding to a minimum of 30 FAs per cell). The red arrows indicate the increased frequency of FAs containing a low pPak level observed in cells plated at a high adhesion strength (FN30). In contrast, the black arrow indicates the increased frequency of FAs containing a high pPak level observed in cells plated at a low adhesion strength (FN5).
Figure 7.
Figure 7.
Pak1TE expression rescues F-actin phenotypes at a high adhesion strength. (A and B) Phase-contrast (A) and FSM images of X-rhodamine actin (B) in migrating PtK1 cells plated at high FN concentration (30 µg/ml) and expressing GFP alone (noted as FN30 control) or GFP–Pak1TE (noted as FN30 Pak1). Insets show GFP expression of the GFP or GFP-Pak1TE constructs. (C) Kymographs taken from lines oriented along the axis of F-actin flow (indicated in B). The lines in C highlight the F-actin flow rates in the lamellipodium (LP) and the lamella (LA). Time bar (t), 2 min; Bar (d), 2 µm. (D) qFSM kinematic maps of the speed of F-actin flow. Note the increased flow in the lamella of the cell expressing Pak1TE (black asterisk) compared with the control cell (white asterisk). (E) qFSM kinetic maps of F-actin polymerization (red) and depolymerization (green) rates. Brightness indicates relative rate magnitude. (F) Average rates of F-actin retrograde flow in the lamellipodium and the lamella of control and Pak1TE-expressing cells ± SEM. The expression of Pak1TE significantly decreased F-actin flow in the lamellipodium, whereas it significantly increased the flow in the lamella (*, P = 0.002 and *, P < 1.10−5, respectively, compared with control cells; Student’s t test). (G) Average width of cellular regions measured from kymographs ± SEM. Pak1TE expression decreased lamellipodium width. *, P < 1.10−5 compared with control; Student’s t test. (F and G) n ≥ 9 cells were analyzed for each condition, with a minimum of 125 measurements per condition.
Figure 8.
Figure 8.
Pak1TE expression rescues myosin IIA distribution at a high adhesion strength. (A) pMLC immunofluorescence and F-actin phalloidin staining in migrating PtK1 cells plated on high FN concentration (30 µg/ml) and expressing GFP (noted FN30 control) or GFP–Pak1TE (noted FN30 Pak1). Insets in pMLC column show GFP expression of the GFP or GFP-Pak1TE constructs. Red lines indicate the leading edge of the cells as determined by the F-actin staining. White boxes in merge column indicate the positions of insets for higher magnifications shown in the rightmost column. (B) Fluorescence intensity of pMLC and F-actin for each indicated condition, measured from the cell edge (0 µm) into the cell center (10 µm). The data shown represent one experiment and are averaged from n ≥ 7 cells for each condition. The experiment was repeated at least three times with similar results. The arrows indicate the myosin IIA–depleted zone from the cell edge.
Figure 9.
Figure 9.
Pak1TE expression rescues FA distribution and dynamics at a high adhesion strength. (A) Paxillin immunofluorescence and F-actin phalloidin staining in migrating PtK1 cells plated on high FN concentration (30 µg/ml) and expressing GFP (noted FN30 control) or GFP–Pak1TE (noted FN30 Pak1). Insets show GFP expression of the constructs. White boxes in the paxillin column indicate the positions of insets for higher magnifications shown in the rightmost column. Pak1TE expression induced the formation of thick paxillin clusters (arrows). (B) An example of GFP-paxillin fluorescence time-lapse images taken in PtK1 cells plated on FN30, control, or expressing Pak1TE. The white boxes in the whole area images (left) indicate the localization of the magnified regions shown in the right panels. Elapsed time in minutes is shown. Arrowheads and arrows indicate assembling and disassembling FAs, respectively. Note that FAs in control cells were sparsely stained and assembled/disassembled slower than those in cells expressing Pak1TE. Bars (left), 5 µm. (C) Average rate constants of FA assembly and disassembly measured from 8–15 FAs per cell ± SEM, and n ≥ 6 cells per condition. *, P = 0.018 compared with control; Student’s t test. (D) Average FA lifetime measured from the initiation of a new GFP-paxillin cluster to complete disappearance (± SEM). Although FAs in control (Ct) cells never disassembled in the 30 min of imaging, some clusters of paxillin in Pak1TE-expressing cells did completely turn over during this period.
Figure 10.
Figure 10.
Pak1TE expression recapitulates protrusiveness and rapid migration at nonoptimal ECM density. (A) Activity maps of cell edge movement over time in migrating PtK1 cells plated at high FN concentration (30 µg/ml) and expressing GFP alone (noted FN30 control) or GFP–Pak1TE (noted FN30 Pak1). Edge displacements are encoded with warm color (red) for protrusion and cold color (blue) for retraction. (B) Average protrusion efficiency ± SEM. n ≥ 5 cells for each condition. *, P < 0.05 compared with a protrusion efficiency of 1. A protrusion efficiency value >1, represented by the red line, indicates a net advancement of the entire leading edge. (C) Individual tracks transposed to a common origin of 15 cells plated on FN30 and expressing GFP–Pak1TE (noted FN30 Pak1) or not (noted FN30 control). Pak1TE expression led to longer migration paths. (D–G) Quantification of motility parameters in C, including net path length (D), the net distance that the cells traversed from the first to the last frame; total path length (E), the total distance traversed by cells over time; directionality (F), the ratio of net to total path length; and (G) cell velocity. The experiment was repeated at least four times, and n ≥ 17 cells analyzed for each condition. **, P < 0.05 and ***, P = 0.001 compared with control (Ct) cells. a.u., arbitrary units. (H) A model of Pak regulation of FA and actomyosin organization. In the presence of active Pak (left), lamellipodium (LP) and lamella (LA) networks present little overlap within the tip of the lamella, adjacent to the cell edge. Myosin IIA is distributed throughout the lamella. FAs appear at the cell edge, mature in the lamella, and disassemble. Coordination between actin dynamics, myosin IIA contractility, and FA turnover leads to efficient protrusion and cell migration. Inhibition of Pak activity (right) widens the lamellipodium and accelerates its F-actin treadmilling rate. In contrast, F-actin retrograde flow in the lamella is inhibited. Myosin IIA is displaced from the leading edge, and FA maturation is decreased. Thus, Pak inhibition reduces the dynamics of edge movements and cell motility.

Similar articles

Cited by

References

    1. Adam L., Vadlamudi R., Mandal M., Chernoff J., Kumar R. 2000. Regulation of microfilament reorganization and invasiveness of breast cancer cells by kinase dead p21-activated kinase-1. J. Biol. Chem. 275:12041–12050 10.1074/jbc.275.16.12041 - DOI - PubMed
    1. Adams M.C., Salmon W.C., Gupton S.L., Cohan C.S., Wittmann T., Prigozhina N., Waterman-Storer C.M. 2003. A high-speed multispectral spinning-disk confocal microscope system for fluorescent speckle microscopy of living cells. Methods. 29:29–41 10.1016/S1046-2023(02)00282-7 - DOI - PubMed
    1. Adams M.C., Matov A., Yarar D., Gupton S.L., Danuser G., Waterman-Storer C.M. 2004. Signal analysis of total internal reflection fluorescent speckle microscopy (TIR-FSM) and wide-field epi-fluorescence FSM of the actin cytoskeleton and focal adhesions in living cells. J. Microsc. 216:138–152 10.1111/j.0022-2720.2004.01408.x - DOI - PubMed
    1. Bagheri-Yarmand R., Vadlamudi R.K., Wang R.A., Mendelsohn J., Kumar R. 2000. Vascular endothelial growth factor up-regulation via p21-activated kinase-1 signaling regulates heregulin-beta1-mediated angiogenesis. J. Biol. Chem. 275:39451–39457 10.1074/jbc.M006150200 - DOI - PubMed
    1. Bokoch G.M. 2003. Biology of the p21-activated kinases. Annu. Rev. Biochem. 72:743–781 10.1146/annurev.biochem.72.121801.161742 - DOI - PubMed

Publication types