. 2011 Sep;79(9):3633-41.
doi: 10.1128/IAI.05459-11. Epub 2011 Jun 27.

Caspase-1 activation of interleukin-1β (IL-1β) and IL-18 is dispensable for induction of experimental cerebral malaria

Affiliations

Caspase-1 activation of interleukin-1β (IL-1β) and IL-18 is dispensable for induction of experimental cerebral malaria

Maximilian Kordes et al. Infect Immun. 2011 Sep.

Abstract

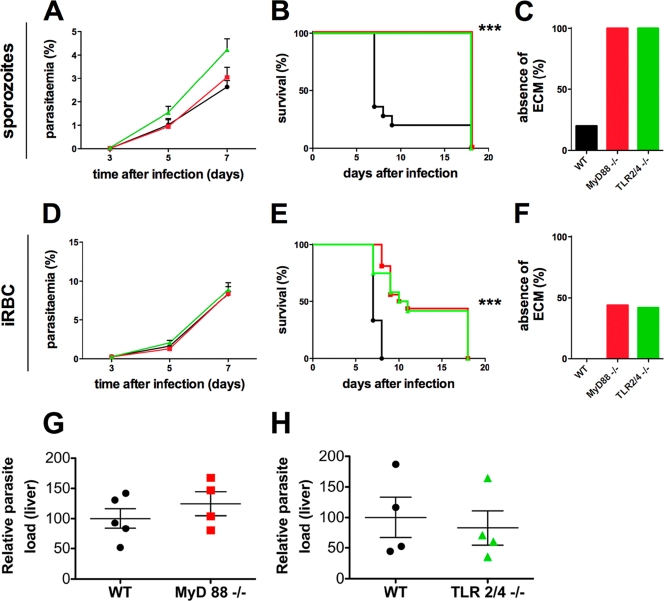
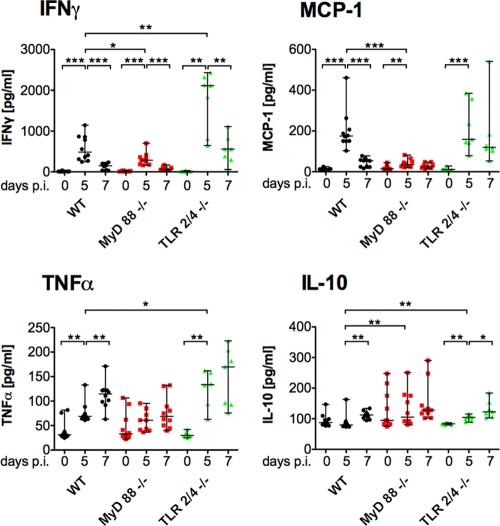
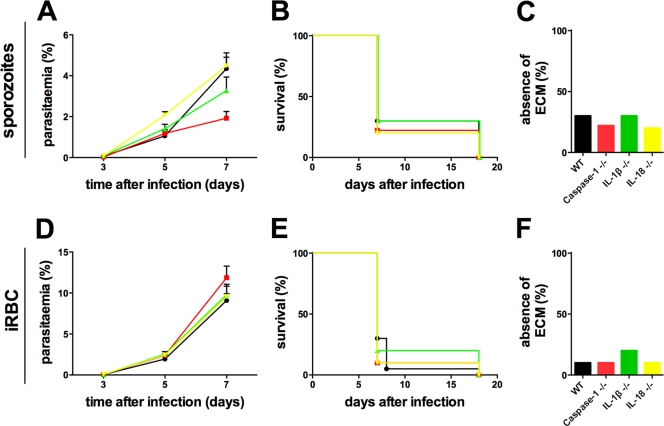
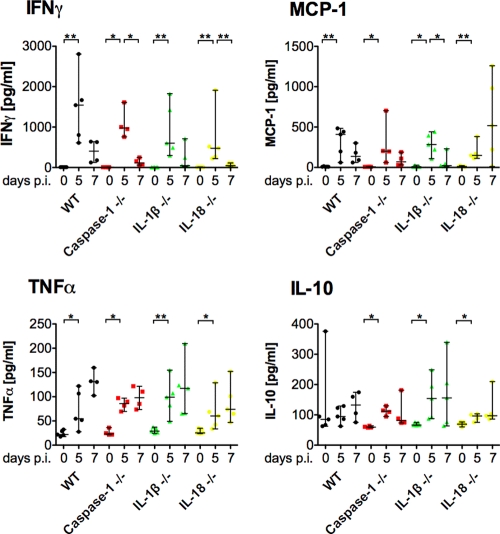
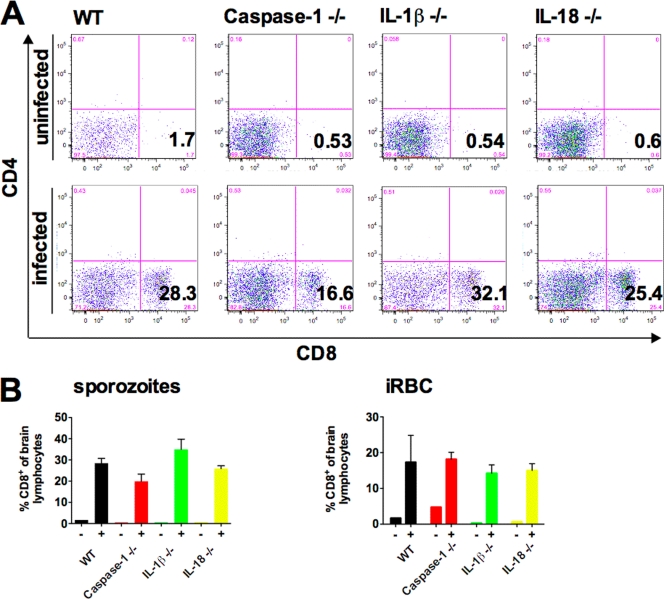
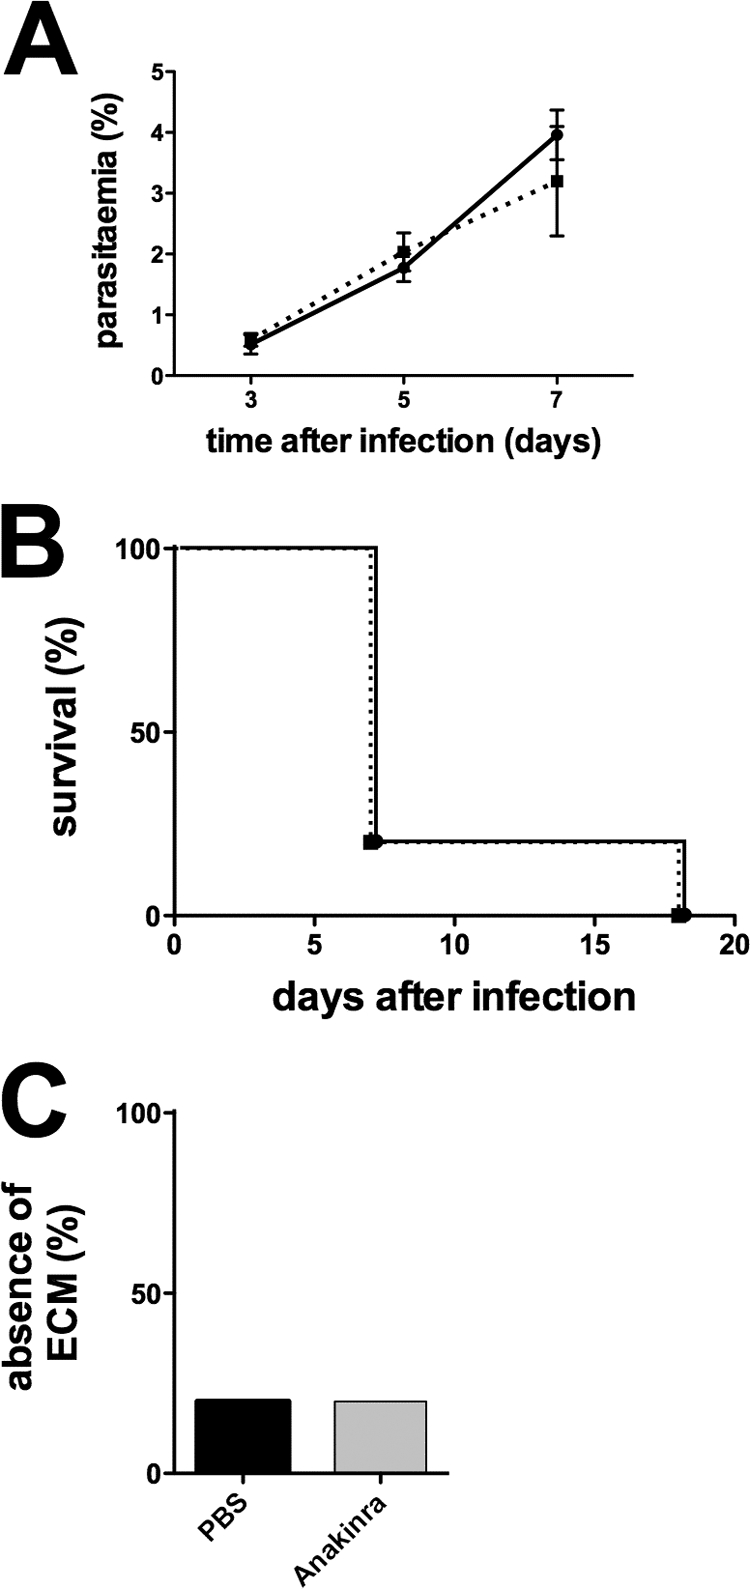
Malaria infection is initiated by sporozoite invasion of hepatocytes and asexual reproduction of liver stages, processes that are regarded to be "clinically and diagnostically silent." Merozoites, which egress from hepatocytes, infect erythrocytes in periodic cycles and induce disease. How the host innate immune system contributes to disease outcomes and to the induction of effector cells during malaria remains unclear. Likewise, how the initial liver stages may shape responses to blood-stage parasites is unknown. Here, using both sporozoite- and blood-stage-induced infections with the rodent malaria parasite Plasmodium berghei ANKA, we show that the MyD88 and Toll-like receptor 2/4 (TLR2/4) pathways play critical roles in the development of experimental cerebral malaria (ECM). Strikingly, an absolute dependence on MyD88 and TLR2/4 was observed when infections were initiated with sporozoites. In addition, we show that caspase-1 activation of interleukin-1β (IL-1β) and IL-18, which is associated with the inflammasome pathway, does not contribute to P. berghei ANKA-induced immunopathology. Consistent with these data, prophylactic cover with the IL-1β antagonist anakinra did not reduce the incidence of ECM. Therefore, we propose that protection against ECM due to loss of TLR signaling functions is caused by effector mechanisms other than IL-1β activation.


Figures

Fig. 1.
Fig. 1.
MyD88−/− and TLR 2/4−/− mice show an increased resistance to experimental cerebral malaria. WT (black, •) MyD88−/− (red, ▪), and TLR 2/4−/− (green, ▴) mice were infected with 104 P. berghei sporozoites (A to C) or iRBCs (D to F) by i.v. injection. (A and D) Average parasitemia during the course of infection. Error bars indicate the standard errors of the means (SEM). Results of a single representative experiment are displayed for one sporozoite-induced and one blood-stage-induced infection (n = 5). No significant differences were observed between any groups of mice. (B and E) Kaplan-Meier analysis of the time from infection to development of signs of ECM. Data were cumulative from multiple experiments. For sporozoite-induced infections: WT, n = 25; MyD88−/−, n = 18; TLR2/4−/−, n = 13. For iRBC-induced infections: WT, n = 15; MyD88−/−, n = 16; TLR 2/4−/−, n = 12. Survival rates were analyzed by using the log rank test. ***, P < 0.001. (C and F) Absence of ECM shown as the percentage of infected animals based on cumulative data. (G and H) MyD88−/− (G) and TLR2/4−/− (H) mice were infected with 104 P. berghei sporozoites. The parasite load in the liver was measured by real-time PCR at 42 h postinfection. No significant differences were observed between groups of mice.
Fig. 2.
Fig. 2.
Plasma concentrations of cytokines correlate with the course of P. berghei infection. Plasma samples were collected before and on day 5 and day 7 after i.v. infection with 104 sporozoites, and the concentrations of IFN-γ, TNF-α, IL-10, and MCP-1 were measured. Data points represent individual animals; median and ranges are displayed for each group at the individual time points. Changes over the course of infection within a group (day 0 versus day 5 and day 5 versus day 7) as well as differences between WT and deficient mice on day 5 and day 7 after infection were assessed using the Mann-Whitney test. *, P < 0.05; **, P < 0.01; ***, P < 0.001.
Fig. 3.
Fig. 3.
P. berghei ANKA infections are unaltered in caspase-1−/−, IL-1β−/−, and IL-18−/− mice. WT (black, •), caspase-1−/− (red, ▪), IL-1β−/− (green, ▴), and IL-18−/− (yellow, ▾) mice were i.v. injected with 104 sporozoites (A to C) or iRBCs (D to F). (A and D) Average parasitemia during the course of infection. Error bars indicate the SEM. Results of 1 representative experiment from 2 experiments are displayed (n = 4 or 5 each). No significant differences were observed between any groups of mice. (C and E) Kaplan-Meier analysis of the time from infection to development of signs of ECM. Data were cumulative from two experiments. For sporozoite-induced infections: WT, n = 10; caspase 1−/−, n = 9; IL-1β−/−, n = 10; IL-18−/−, n = 10. For iRBC-induced infections: WT, n = 20; caspase 1−/−, n = 10; IL-1β−/−, n = 10; IL-18−/−, n = 10. Survival rates were analyzed by using the log rank test. No significant differences were observed between any groups of mice (P > 0.05). (C and F) Absence of ECM shown as the percentage of infected animals based on cumulative data.
Fig. 4.
Fig. 4.
Effect of deficiency in caspase-1, IL-1β, or IL-18 on the kinetics of cytokines over the course of P. berghei infections. Plasma samples were collected before and 5 and 7 days after i.v. infection with 104 P. berghei sporozoites, and levels of IFN-γ, TNF-α, IL-10, and MCP-1 were measured. Data points represent individual animals; medians and ranges are displayed for each group at the individual time points. Changes over the course of infection within a group (day 0 versus day 5 and day 5 versus day 7) as well as differences between WT and deficient mice on day 5 and day 7 after infection were assessed using the Mann-Whitney test. *, P < 0.05; **, P < 0.01.
Fig. 5.
Fig. 5.
CD8+ T cells sequester to the brains of caspase-1−/−, IL-1β−/−, and IL-18−/− mice suffering from ECM. (A) Representative dot plots of leukocytes from brains of naïve mice and of mice suffering from ECM at 7 days after P. berghei sporozoite injection. (B) Percentages of CD8+ cells among total brain-derived leukocytes from mice that developed ECM (+) and naïve age-matched control mice (−).
Fig. 6.
Fig. 6.
Treatment with anakinra does not improve the clinical course of P. berghei ANKA infection. WT C57BL/6 mice (n = 5) were infected with 104 P. berghei ANKA sporozoites i.v. and treated for 7 days with 250 mg/kg anakinra i.p. once daily (▪). Controls were infected with the same number of parasites and received injections of PBS (•). (A) Average parasitemia during the course of infection. Error bars indicate the SEM. (B) Kaplan-Meier analysis of the time from infection to development of signs of ECM. (C) Absence of ECM shown as the percentage of infected animals.

References

    1. Adachi O., et al. 1998. Targeted disruption of the MyD88 gene results in loss of IL-1- and IL-18-mediated function. Immunity 9:143–150 - PubMed
    1. Adams S., Brown H., Turner G. 2002. Breaking down the blood-brain barrier: signaling a path to cerebral malaria? Trends Parasitol. 18:360–366 - PubMed
    1. Amani V., et al. 2000. Involvement of IFN-gamma receptor-medicated signaling in pathology and anti-malarial immunity induced by Plasmodium berghei infection. Eur. J. Immunol. 30:1646–1655 - PubMed
    1. Bagot S., et al. 2004. Comparative study of brain CD8+ T cells induced by sporozoites and those induced by blood-stage Plasmodium berghei ANKA involved in the development of cerebral malaria. Infect. Immun. 72:2817–2826 - PMC - PubMed
    1. Bazan J. F., Timans J. C., Kastelein R. A. 1996. A newly defined interleukin-1? Nature 379:591. - PubMed

Publication types

MeSH terms

LinkOut - more resources