. 2011 Sep;79(9):3527-40.
doi: 10.1128/IAI.05139-11. Epub 2011 Jun 27.

Differential response of the human renal proximal tubular epithelial cell line HK-2 to Shiga toxin types 1 and 2

Affiliations

Differential response of the human renal proximal tubular epithelial cell line HK-2 to Shiga toxin types 1 and 2

Erin K Lentz et al. Infect Immun. 2011 Sep.

Abstract

Shiga toxins (Stxs) are expressed by the enteric pathogens Shigella dysenteriae serotype 1 and certain serotypes of Escherichia coli. Stx-producing bacteria cause bloody diarrhea with the potential to progress to acute renal failure. Stxs are potent protein synthesis inhibitors and are the primary virulence factors responsible for renal damage that may follow diarrheal disease. We explored the use of the immortalized human proximal tubule epithelial cell line HK-2 as an in vitro model of Stx-induced renal damage. We showed that these cells express abundant membrane Gb(3) and are differentially susceptible to the cytotoxic action of Stxs, being more sensitive to Shiga toxin type 1 (Stx1) than to Stx2. At early time points (24 h), HK-2 cells were significantly more sensitive to Stxs than Vero cells; however, by 72 h, Vero cell monolayers were completely destroyed while some HK-2 cells survived toxin challenge, suggesting that a subpopulation of HK-2 cells are relatively toxin resistant. Fluorescently labeled Stx1 B subunits localized to both lysosomal and endoplasmic reticulum (ER) compartments in HK-2 cells, suggesting that differences in intracellular trafficking may play a role in susceptibility to Stx-mediated cytotoxicity. Although proinflammatory cytokines were not upregulated by toxin challenge, Stx2 selectively induced the expression of two chemokines, macrophage inflammatory protein-1α (MIP-1α) and MIP-1β. Stx1 and Stx2 differentially activated components of the ER stress response in HK-2 cells. Finally, we demonstrated significant poly(ADP-ribose) polymerase (PARP) cleavage after exposure to Stx1 or Stx2. However, procaspase 3 cleavage was undetectable, suggesting that HK-2 cells may undergo apoptosis in response to Stxs in a caspase 3-independent manner.


Figures

Fig. 1.
Fig. 1.
Analysis of Gb3 expression on the surfaces of HK-2 cells. HK-2 cells were treated with Stx1 B subunits on ice for 1 h. The cells were subsequently washed and incubated with 13C4, an anti-Stx1 monoclonal antibody, on ice for 30 min. After centrifugation, the cells were washed and incubated with fluorescein isothiocyanate (FITC)-conjugated anti-mouse IgG antibody for 30 min. After washing, the cells were subjected to fluorescence-activated cell sorter (FACS) analysis for membrane Gb3 expression. The data shown are the means ± SEM for three independent experiments.
Fig. 2.
Fig. 2.
Cytotoxic effects of Stx1 and Stx2 on HK-2 cells. HK-2 cells (5 × 10⁴ cells per well) were incubated with different concentrations of either Stx1 or Stx2, as indicated. After incubation for 24 h (A), 48 h (B), or 72 h (C), viable-cell numbers were estimated by MTT assay. The graphs depict percent cell viability compared to untreated cells and represent the means ± SEM of three independent experiments. The asterisks denote significant differences between cells stimulated with Stx1 and Stx2 (*, P < 0.05; **, P < 0.01).
Fig. 3.
Fig. 3.
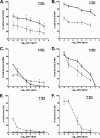
Cytotoxic response of Vero cells to Stx1 or Stx2 versus that of HK-2 cells. Vero or HK-2 cells (5 × 10⁴ cells per well) were incubated with different concentrations of either Stx1 or Stx2, as indicated. After incubation for 24 h (A and B), 48 h (C and D), or 72 h (E and F), viable-cell numbers were estimated by MTT assay. The graphs depict percent cell viability compared to untreated cells and represent the means ± SEM of three independent experiments. Vero cell and HK-2 cell cytotoxicities are denoted by solid lines and dashed lines, respectively. The asterisks denote significant differences between Vero and HK-2 cells (*, P < 0.05; **, P < 0.01).
Fig. 4.
Fig. 4.
Stx1 B subunit-Alexa 488 trafficking in HK-2 cells. HK-2 cells were treated with 100 nM Lyso-Tracker (red) or 60 nM ER-Tracker (blue) live-cell-staining dyes for detection of the lysosomal compartment and endoplasmic reticulum, respectively. Subsequently, the cells were stimulated with complete medium containing 100 ng/ml Stx1 B-Alexa 488 (green) for the indicated times. A single confocal optical section through the middle of the majority of cells in the field of view was taken for red, blue, and green emission channels simultaneously using a Stallion Digital imaging station. The presence of yellow or light-blue fluorescence in the merged images indicates toxin colocalization. The images are representative of two independent experiments. All data within each experiment were collected at identical settings.
Fig. 5.
Fig. 5.
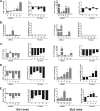
Cytokine and chemokine production elicited by Stx1 and Stx2 treatment of HK-2 cells. HK-2 cells were stimulated with 75 pg/ml of either Stx1 or Stx2 for 15, 30, 60, 120, or 240 min. Total RNA was isolated, DNase treated, and cDNA synthesized. Quantitative real-time PCR was performed with primers specific for TNF-α (A), IL-1β (B), IL-8 (C), MIP-1α (D), MIP-1β (E), and the internal control GAPDH. Relative expression was calculated using the ΔCT method and expressed as fold change relative to untreated-control levels (gray bars). The data were derived from at least two independent experiments. Cell supernatants were collected and analyzed for TNF-α, IL-1β, IL-8, MIP-1α, and MIP-1β proteins as described in Materials and Methods (black bars). The data shown are the mean fold change ± SEM derived from three independent experiments. Statistical significance was calculated using one-way ANOVA (*, P < 0.05; **, P < 0.01; ***, P < 0.001).
Fig. 6.
Fig. 6.
UPR sensors are differentially activated after Stx1 or Stx2 exposure in HK-2 cells. (A and B) HK-2 cells were stimulated with 75 pg/ml Stx1 or Stx2, and at the indicated time points, cells were lysed and whole-cell lysates (100 μg/well) were subjected to SDS-PAGE (4% to 20%) and probed using antibodies specific for the activated forms of the UPR signaling molecules ATF6 (50 kDa) (A), phospho-PERK (170 kDa) (B), and phospho-IRE1α (110 kDa). The blots shown are characteristic of at least three independent experiments. (C and D) Mean densitometric readings of Western blot band intensities from three independent experiments. The data are expressed as means plus SEM; statistical significance was calculated using one-way ANOVA (*, P < 0.05; ***, P < 0.001) compared to control untreated cells.
Fig. 7.
Fig. 7.
The ER stress response is differentially activated in HK-2 cells in response to Stx1 or Stx2 treatment. HK-2 cells were exposed to 75 pg/ml Stx1 or Stx2, and at the indicated time points, cells were lysed and whole-cell lysates (100 μg/well) were subjected to SDS-PAGE (4% to 20%) and probed using antibodies specific for BiP (78 kDa) (A) and CHOP (28 kDa) (B). The blots shown are characteristic of three independent experiments. The bar graphs depict fold changes derived from mean densitometric readings of Western blot band intensities from three independent experiments. The data are expressed as means plus SEM, and statistical significance was calculated using one-way ANOVA. The asterisks denote significant differences compared to control cells (*, P < 0.05; **, P < 0.01; ***, P < 0.001; NS, not significant).
Fig. 8.
Fig. 8.
Stx1 and Stx2 treatment induces caspase 3-independent PARP cleavage. (A) HK-2 cells were stimulated with 75 pg/ml Stx1 or Stx2, and at the indicated time points, cells were lysed and whole-cell lysates (100 μg/well) were subjected to SDS-PAGE (4% to 20%) and probed using antibodies specific for cleaved PARP (c-PARP; 89 kDa), caspase 3 (17 kDa), and caspase 8 (43 kDa). The blots shown are characteristic of three independent experiments. WB, Western blotting. (B) Fold changes in PARP and procaspase 8 cleavage derived from mean densitometric readings of Western blot band intensities from three independent experiments. The data are expressed as means plus SEM, and statistical significance was calculated using one-way ANOVA. The asterisks denote significant differences compared to control cells (*, P < 0.05; **, P < 0.01; ***, P < 0.001; NS, not significant). (C) HK-2 cells were stimulated with doxorubicin HCl as a positive control for apoptosis induction for 6 h, subjected to SDS-PAGE, and probed using antibodies specific for caspase 3.
Fig. 9.
Fig. 9.
Potential role of human proximal tubule epithelial cells in the pathogenesis of hemolytic uremic syndrome. (A) STEC adheres to the colonic epithelium. (B) The bacteria produce and release Stxs (green), which may gain access to the submucosa via transcytotic or paracellular mechanisms. (C) Stxs are internalized by resident tissue macrophages, inducing the production and secretion of proinflammatory cytokines and chemokines. Simultaneously, Stxs bind to and “piggyback” on neutrophils through circulation. (D) TNF-α and IL-1β upregulate expression of the Stx receptor on endothelial cells, resulting in increased vascular damage and systemic transport of Stxs in the blood. (E) Once in circulation, Stxs target the renal epithelium, which is rich in membrane-bound Gb3. Renal proximal tubular epithelial cells are damaged, but a subpopulation of cells survive and, in response to Stx2, secrete both MIP-1α and MIP-1β, which in turn recruit inflammatory cells, such as macrophages and neutrophils, to sites of damage. (F) Activated macrophages secrete TNF-α and IL-1β, further sensitizing the microvascular endothelial cells. (G) Fibrin deposits build up in the microvasculature of the kidney, trapping circulating red blood cells and platelets. (Figure adapted from Medical Illustrations, Michal Komorniczak, with permission.)

Similar articles

Cited by

References

    1. Bauwens A., et al. 2011. Differential cytotoxic actions of Shiga toxin 1 and Shiga toxin 2 on microvascular and macrovascular endothelial cells. Thromb. Haemost. 105:515–528 - PubMed
    1. Bernales S., Papa F. R., Walter P. 2006. Intracellular signaling by the unfolded protein response. Annu. Rev. Cell Dev. Biol. 22:487–508 - PubMed
    1. Boerlin P., et al. 1999. Associations between virulence factors of Shiga toxin-producing Escherichia coli and disease in humans. J. Clin. Microbiol. 37:497–503 - PMC - PubMed
    1. Breckenridge D. G., Germain M., Mathai J. P., Nguyen M., Shore G. C. 2003. Regulation of apoptosis by endoplasmic reticulum pathways. Oncogene 22:8608–8618 - PubMed
    1. Brigotti M., et al. 2008. Interactions between Shiga toxins and human polymorphonuclear leukocytes. J. Leukoc. Biol. 84:1019–1027 - PubMed

Publication types

MeSH terms