. 2011 Sep;31(17):3616-29.
doi: 10.1128/MCB.05164-11. Epub 2011 Jun 27.

PERK integrates autophagy and oxidative stress responses to promote survival during extracellular matrix detachment

Affiliations

PERK integrates autophagy and oxidative stress responses to promote survival during extracellular matrix detachment

Alvaro Avivar-Valderas et al. Mol Cell Biol. 2011 Sep.

Abstract

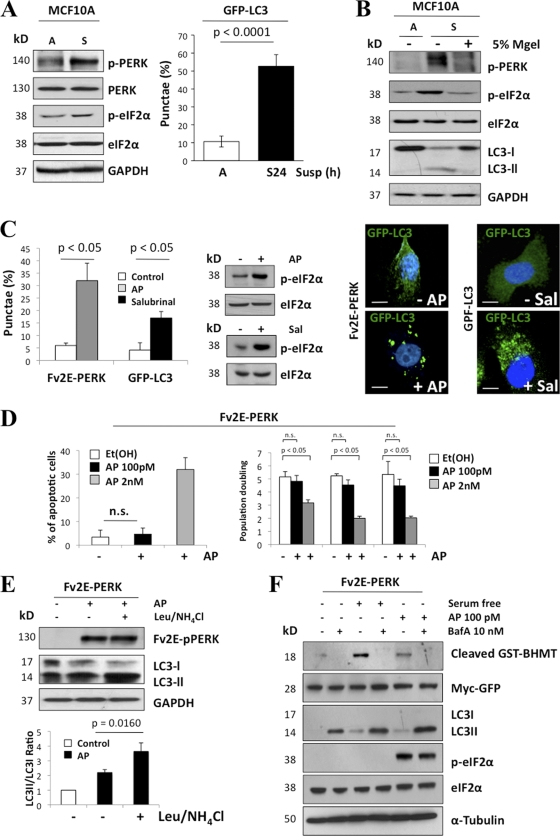
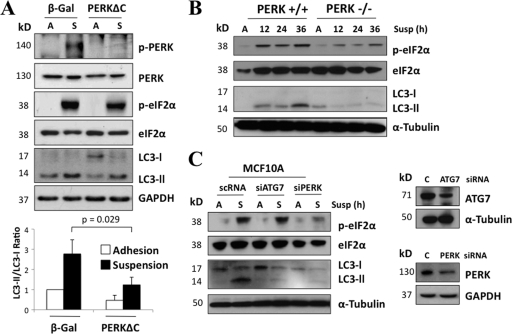
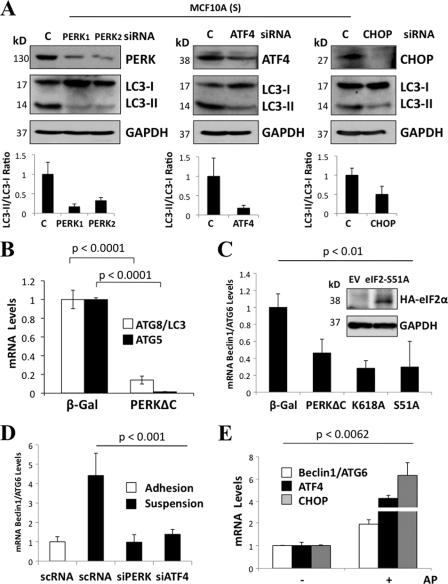
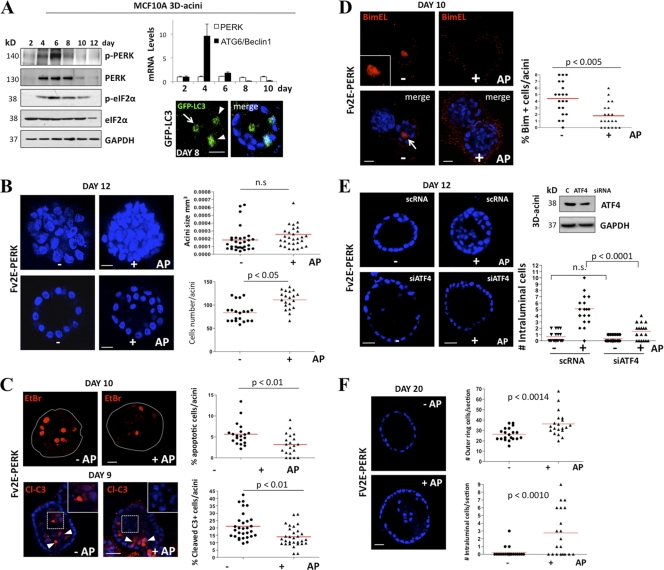
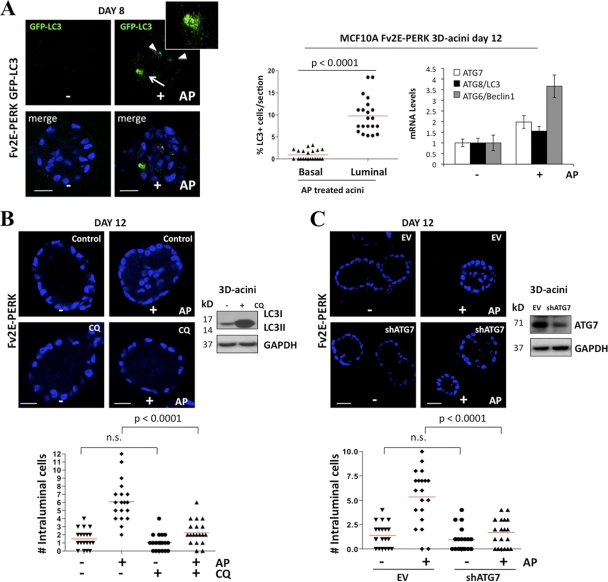
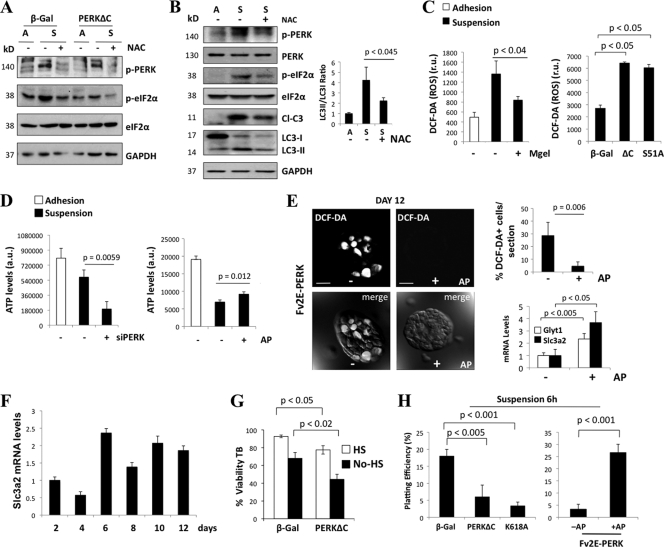
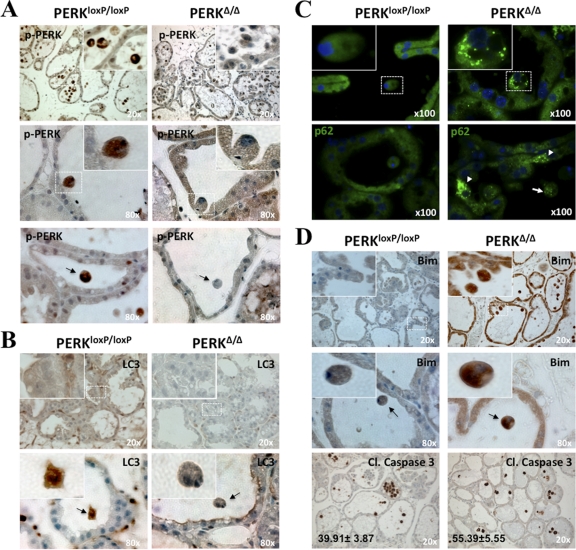
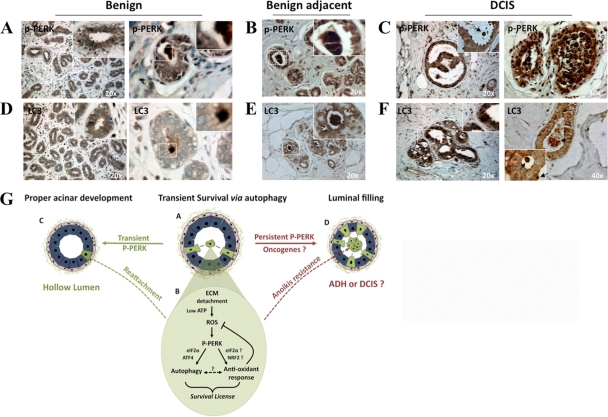
Mammary epithelial cells (MECs) detached from the extracellular matrix (ECM) produce deleterious reactive oxygen species (ROS) and induce autophagy to survive. The coordination of such opposing responses likely dictates whether epithelial cells survive ECM detachment or undergo anoikis. Here, we demonstrate that the endoplasmic reticulum kinase PERK facilitates survival of ECM-detached cells by concomitantly promoting autophagy, ATP production, and an antioxidant response. Loss-of-function studies show that ECM detachment activates a canonical PERK-eukaryotic translation initiation factor 2α (eIF2α)-ATF4-CHOP pathway that coordinately induces the autophagy regulators ATG6 and ATG8, sustains ATP levels, and reduces ROS levels to delay anoikis. Inducible activation of an Fv2E-ΔNPERK chimera by persistent activation of autophagy and reduction of ROS results in lumen-filled mammary epithelial acini. Finally, luminal P-PERK and LC3 levels are reduced in PERK-deficient mammary glands, whereas they are increased in human breast ductal carcinoma in situ (DCIS) versus normal breast tissues. We propose that the normal proautophagic and antioxidant PERK functions may be hijacked to promote the survival of ECM-detached tumor cells in DCIS lesions.


Figures

Fig. 1.
Fig. 1.
PERK activation in ECM-detached cells is associated with autophagy induction. (A) Whole-cell lysates from MCF10A cells adhered (A) or suspended for 24 h (S) and immunoblotted (IB) with indicated antibodies (Abs). The graph shows the percentage of autophagic (autophagosome puncta staining) MCF10A GFP-LC3 adhered or 24 h suspended cells. (B) Adhered (A) or suspended (S) MCF10A cells were treated or not treated with 5% Matrigel (MGel), and LC3 processing was detected by IB. (C) Adhered Fv2E-ΔNPERK MCF10A cell lines were transfected with GFP-LC3 plasmid and treated or not treated (control) with 100 pM AP10287 (AP) (dimerizing molecule) for 24 h, or adhered GFP-CL3 MCF10A cells were treated or not treated (control) with 100 nM salubrinal; cells were fixed and the percentage of autophagic cells was scored and quantified using fluorescence microscopy. The right panels show representative images of autophagic Fv2E-ΔNPERK (+AP) and GFP-LC3 (+Sal) MCF10A cells. Blue, 4′,6′-diamidino-2-phenylindole (DAPI); green, GFP-LC3. Scale bars are 5 μm. (D) Adhered Fv2E-ΔNPERK MCF10A cell line transfected with GFP-LC3 plasmid and treated with 100 pM or 2 nM AP or with vehicle [Et(Oh)] for 24 h were stained with EtBr, and the percentage of apoptotic cells was further measured by FACS. Right graph, population doubling during exponential growth (from day 2 to 8) of Fv2E-ΔNPERK MCF10A cells treated with vehicle (ethanol) or 100 pM or 2 nM AP. Cells were collected, and viability was determined using trypan blue exclusion. n.s., not significant. (E) Whole-cell lysates from Fv2E-ΔNPERK MCF10A cells treated or not treated with 100 pM AP and in combination with 0.1 mM leupeptin and 20 mM NH4Cl as indicated were analyzed by IB for the indicated antigens. Leupeptin- and NH4Cl-mediated inhibition of lysosomal degradation resulted in LC3-II accumulation (lane 3). Densitometric analysis (bottom panel) for LC3 flux was determined using Image J software (n = 3). (F) MCF10A cells were transfected with 5 μg cDNA encoding GST-BHMT (glutathione S-transferase fused to betaine homocysteine S methyltransferase 1). After 24 h, the cells were cultured in full growth medium, serum-free medium (6 h), or medium with AP20185 (100 pM) in the presence or absence of 10 nM bafilomycin A1 (BafA). Whole-cell lysates were immunoblotted for the indicated antigens. Myc Ab was used to detect GFP-myc (expressed from an internal ribosome entry site [IRES] sequence) as a control for transfection efficiency.
Fig. 2.
Fig. 2.
PERK inhibition partially reverts suspension-induced autophagy. (A) Lysates from adhered (A) or 6 h suspended (S) β-Gal and PERKΔC MCF10A cells were analyzed by IB for the indicated antigens. Densitometric analysis for LC3 flux was done using Image J software (n = 3). (B) Lysates of PERK+/+ and PERK−/− mouse embryonic fibroblasts (MEFs) were collected at the indicated time points, and the indicated antigens were detected by IB. (C) MCF-10A lysates from attached (A) and suspended (S) cells that were transfected with ATG7, PERK, or control (C) siRNA were used for IB against the indicated antigens. Results for the ATG7 and PERK knockdown controls are shown in the right panel.
Fig. 3.
Fig. 3.
Phosphorylation of PERK and eIF2α at Ser51 is required for efficient induction of ATG genes during suspension. (A) Lysates from MCF10A cells were suspended for 6 h (S) and transfected with PERK 1, PERK 2, ATF4, CHOP, and scRNA (C) siRNAs and immunoblotted for the indicated antigens. The graphs below the blots show densitometric analysis for LC3-II/LC3-I ratios as quantified using Image J software (n = 3). (B to E) Graphs showing quantitative PCR (qPCR) analysis of ATG8/LC3 and ATG5 mRNA transcript levels from β-Gal and PERKΔC MCF10A cells (B), Beclin1/ATG6 mRNA transcript levels from β-Gal, PERKΔC, PERK kinase-dead mutant K618A (K618A), and S51A-eIF2α mutant (S51A) suspended MCF10A cultures. (C) The inset shows a control IB of MCF10A cells stably expressing pBabepuro-HA-eIF2αS51A mutant or the empty vector (EV), which were immunoblotted with hemagglutinin (HA) and GAPDH (glyceraldehyde-3-phosphate dehydrogenase) Abs. (D and E) Beclin1/ATG6 mRNA transcript levels in adhered and suspended cultures transfected with PERK, ATF4, and control (C) siRNAs (D) and CHOP, ATF4, and Beclin1/ATG6 mRNA transcripts levels of Fv2E-PERK with (+) or without (−) 100 pM AP for 24 h (E). GAPDH mRNA was used for normalization.
Fig. 4.
Fig. 4.
Unscheduled activation of PERK induces luminal space filling. (A) Whole-cell lysates from 2- to 12-day-old MCF10A acini were immunoblotted with the indicated Abs. The upper right panel shows PERK and Beclin1/ATG6 mRNA transcript levels normalized to GAPDH mRNA from 3D Matrigel acini collected at the indicated time points. Confocal equatorial images from GFP-LC3 (the distribution of LC3-positive events is quantified in Fig. 5A) MCF10A acini fixed at day 8 show punctate basal (arrowheads) and luminal (arrow) LC3 staining (green). Blue, DAPI. Scale bars are 25 μm. (B) Confocal images of day 12 MCF10A Fv2E-ΔNPERK acini treated from day 6 to day 12 (+) or not treated (−) with 100 pM AP, showing stacked sections to reveal increased cellularity and compaction (upper panels) or equatorial confocal sections of acini (lower panels). The graph (upper right panel) shows the distribution and mean size of day 12 MCF10A Fv2E-ΔNPERK acini treated from day 6 (+) or not treated (−) with 100 pM AP. Size was calculated using SPOT software following the equation [(length × width2)/2 = acinus volume (mm3)] (n = 50). The total number of cells per acinus (lower right panel) was also calculated (n = 50). (C) Fv2E-ΔNPERK acini treated from day 6 to days 9 and 10 (+) or not treated (−) with 100 pM AP were stained with 1 μg/ml EtBr (day 10) or cleaved caspase-3 (Cl-c3) at day 9. Magnifications show intraluminal Cl-c3 staining in nontreated acini versus negative Cl-c3 staining in AP-treated acini. The percentage of apoptotic cells was scored (right graphs) (n = 40). (D) Confocal equatorial images from Fv2E-ΔNPERK MCF10A acini treated from day 6 to day 12 (+) or not treated (−) with 100 pM AP, showing intraluminal BimEL staining (red). The graph shows the distribution and mean number of intraluminal BimEL-positive cells per acinus. (E) Confocal equatorial images from Fv2E-ΔNPERK acini treated from day 6 to day 12 (+) or not treated (−) with 100 pM AP and transfected with ATF4 or control (scRNA) siRNA. The right graph show the distribution and mean number of intraluminal cells for each equatorial section of a single acinus (n = 20). Scale bar = 10 μm. The right blot shows controls for ATF4 knockdown in the 3D cultures. (F) Equatorial confocal section images of day 20 MCF10A Fv2E-ΔNPERK acini treated from day 6 to day 20 (+) or not treated (−) with 100 pM AP, showing intraluminal filling (left panels). Graphs (right panels) show the mean number and distribution of cells in the outer ring per section (upper panel) and the total number of intraluminal cells per section (lower panel) (n = 50). In all of the images blue shows DAPI staining of nuclear DNA, and unless otherwise indicated, scale bars indicate 25 μm. P values were determined by the t test.
Fig. 5.
Fig. 5.
PERK promotes survival in the luminal compartment via autophagy. (A) Representative confocal images of day 8 Fv2E-ΔNPERK and GFP-LC3 MCF10A acini treated from day 6 to 8 (+) or or not treated (−) with 100 pM AP, showing intraluminal LC3-puncta staining within cells (green). Middle panel, percentage of intraluminal LC3-puncta staining cells (n = 50); right panel, graph showing ATG gene mRNA transcript levels (middle panel) normalized to GAPDH. (B and C) Confocal equatorial images from Fv2E-ΔNPERK acini treated from day 6 to day 12 (+) or or not treated (−) with 100 pM AP and/or 20 μM chloroquine (CQ) (B) or shRNA ATG7 or control empty vector (EV) (C). The lower graphs show the distribution and mean number of intraluminal cells for each equatorial section of a single acinus (n = 20). Scale bar = 10 μm. Right blots show controls for CQ inhibition of autophagy (B) and ATG7 knockdown (C) in the 3D cultures. In all of the images, blue indicates DAPI staining of nuclear DNA, and unless otherwise indicated, scale bars indicate 25 μm. P values were determined by the t test.
Fig. 6.
Fig. 6.
PERK-eIF2α protects luminal cells from anoikis in part by relieving oxidative stress. (A) Whole-cell lysates from adhered (A) and 24-h-suspended (S) β-Gal and PERKΔC MCF10A cells were treated (+) or not treated (−) with 5 mM NAC and immunoblotted with the indicated Abs. GAPDH was used as a loading control. (B) Cell lysates from adhered (A) and 6-h-suspended (S) MCF10A cells were treated (+) or not treated (−) with 5 mM NAC and immunoblotted with the indicated Abs. Note that LC3 processing in suspension is inhibited by NAC treatment. Densitometric analysis (right panel) for LC3 flux was determined using Image J software (n = 3). (C) ROS levels of 6-h-suspended MCF10A cells cultured with (+) or without (−) 5% Matrigel and β-Gal. Levels for PERKΔC (ΔC) or eIF2α Ser51A (S/A) MCF10A cells were measured with DCF-DA and FACS. (D) ATP levels in adhered and 6-h-suspended MCF10A cells transfected with a PERK siRNA (+) or scrambled siRNA control (−) and in Fv2E-PERK MCF10A cells treated (+) or not treated (−) with 100 pM AP. (E) Confocal images from Fv2E-ΔNPERK MCF10A acini treated from day 6 to day 12 (+) or not treated (−) with 100 pM AP. At 15 min before confocal analysis, cells were treated with 2 μM DCF-DA. The lower panels show differential interference contrast (DIC) microscopy plus DCF-DA fluorescence. Upper right graph, quantification of DCF-DA-positive cells per equatorial section (n = 7). Lower right graph, qPCR analysis of Glyt1 and Slc3a2 mRNA transcript levels from Fv2E-ΔNPERK MCF10A acini treated from day 6 to day 12 (+) or not treated (−) with 100 pM AP and normalized to GAPDH mRNA. (F) qPCR analysis of Slc3a2 mRNA transcript levels from Fv2E-ΔNPERK MCF10A acini treated from day 6 to day 12 (+) or not treated (−) with 100 pM AP at the indicated time points. (G) β-Gal- and PERKΔC-MCF10A 6-h-suspended cultures grown in full or serum (HS)-free medium were analyzed for viability using the trypan blue (TB) exclusion test. (H) β-Gal, PERKΔC (ΔC), or K618A PERK MCF10A 6-h-suspended cultures were collected and assayed for plating efficiency. PERKΔC or K618A PERK mutants inhibited plating efficiency (left panel). Fv2E-ΔNPERK MCF10A 6-h-suspended cultures (right panel) treated with 100 pM AP (+) exhibited a higher plating efficiency than nontreated cultures (−). P values were determined by the t test.
Fig. 7.
Fig. 7.
PERK promotes autophagy and survival in lactating mammary glands. Detection of P-PERK (A), LC3 (B), p62 (C), and BimEL and cleaved caspase-3 (D) in day 12 lactating mammary glands sections from control PERKloxP/loxP and mammary gland-specific PERK knockout (PERKΔ/Δ) mice was done by immunohistochemistry (A, B, and D) and immunofluorescence (C). (A) Images showing enhanced P-PERK staining in the control tissues along with strong staining in detaching (middle panels and insets) and luminal cells (arrow, lower panels), which is lost in PERKΔ/Δ tissues. (B) Images showing enhanced LC3 staining (upper panels and insets) and detachment-induced LC3 expression (lower panels) in PERKloxP/loxP control tissues, which is lost in PERKΔ/Δ tissues. (C) Images showing enhanced p62 punctate staining in PERKΔ/Δ versus control tissues. Insets show magnification to illustrate the accumulation of p62 in autophagosomes. Arrows show p62 punctate staining in both basal (arrowheads) and ECM-detached (arrow) cells in PERKΔ/Δ tissues. (D) Upper and middle rows, images showing enhanced BimEL staining in PERKΔ/Δ versus control tissues. Insets show magnification details. The middle panels show strong BimEL staining of PERKΔ/Δ detached cells located within the lumen (arrows). Lower panels show cleaved caspase-3 staining in PERKΔ/Δ and control tissues, which displayed more cellularity than the KO mammary epithelium. Numbers in the lower left corners are the means ± standard errors of the means (SEM) of the percentages of cleaved caspase-3-positive luminal cells per field; ∼1,000 total luminal cells were scored. Blue, hematoxylin and eosin (H&E) staining.
Fig. 8.
Fig. 8.
PERK phosphorylation and LC3 expression in normal and DCIS tissues (A and F) and a model summarizing the findings (G). (A to C) Representative images of benign (A), benign adjacent (B), and DCIS (C) human mammary gland tissues embedded in paraffin blocks, sectioned, and stained with P-PERK Ab. The insets show detailed magnifications of lumens and detaching cells (arrow in panel C) with strong P-PERK. (D to F) Representative images of benign (D), benign adjacent (E), and DCIS (F) human mammary gland tissues embedded in paraffin blocks, sectioned, and stained with LC3 Ab. The insets show detailed magnifications of lumens and detaching cells (arrows in panel F) with enhanced LC3 staining. Blue, H&E staining. Total samples tested, n = 5; samples shown, n = 2. Patterns were similar in all 5 control or tumor tissues. (G) Model of PERK-induced survival during lumen formation. During mammary acinar development or tissue maintenance, MECs that become detached (A, green cells) activate a “survival license”-dependent PERK activation (B, pathway). Upon loss of adhesion, ROS accumulate due to low ATP production. PERK senses this signal, possibly due to misfolding on nascent proteins in the ER, and phosphorylates eIF2α. This in turn results in ATF4 and CHOP upregulation of autophagy genes such as ATG7 (B, autophagy), which promotes survival of suspended cells. Concomitantly, PERK, possibly through eIF2α→ATF4 or other transcription factors such as NRF2, induces genes that allow ROS detoxification via the upregulation of GSH (B, antioxidant response). Whether autophagy and antioxidant responses are interdependent is unclear at this time. During normal acinar development the “survival license” activated by PERK, which expires after 6 to 8 h, provides a window of opportunity for some luminal cells to resist anoikis, reattach, and contribute to the timely organization of a polarized acinus (C, hollow lumen). However, signals (e.g., oncogenes) that maintain activated PERK might hijack this “survival license” to make it permanent (D). This results in anoikis resistance and luminal occupancy, which might favor the progressive development of cancer lesions such as DCIS.

References

    1. Barone M. V., Crozat A., Tabaee A., Philipson L., Ron D. 1994. CHOP (GADD153) and its oncogenic variant, TLS-CHOP, have opposing effects on the induction of G1/S arrest. Genes Dev. 8:453–464 - PubMed
    1. Bi M., et al. 2005. ER stress-regulated translation increases tolerance to extreme hypoxia and promotes tumor growth. EMBO J. 24:3470–3481 - PMC - PubMed
    1. Blais J. D., et al. 2006. Perk-dependent translational regulation promotes tumor cell adaptation and angiogenesis in response to hypoxic stress. Mol. Cell. Biol. 26:9517–9532 - PMC - PubMed
    1. Bobrovnikova-Marjon E., et al. 2010. PERK promotes cancer cell proliferation and tumor growth by limiting oxidative DNA damage. Oncogene 29:3881–3895 - PMC - PubMed
    1. Bobrovnikova-Marjon E., et al. 2008. PERK-dependent regulation of lipogenesis during mouse mammary gland development and adipocyte differentiation. Proc. Natl. Acad. Sci. U. S. A. 105:16314–16319 - PMC - PubMed

Publication types

MeSH terms

LinkOut - more resources