. 2011 Sep;55(9):4326-37.
doi: 10.1128/AAC.01819-10. Epub 2011 Jun 27.

Reduction in membrane phosphatidylglycerol content leads to daptomycin resistance in Bacillus subtilis

Affiliations

Reduction in membrane phosphatidylglycerol content leads to daptomycin resistance in Bacillus subtilis

Anna-Barbara Hachmann et al. Antimicrob Agents Chemother. 2011 Sep.

Abstract

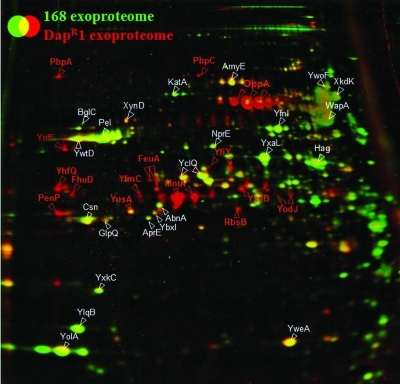
Daptomycin (DAP) is a cyclic lipopeptide that disrupts the functional integrity of the cell membranes of Gram-positive bacteria in a Ca(2+)-dependent manner. Here we present genetic, genomic, and phenotypic analyses of an evolved DAP-resistant isolate, Dap(R)1, from the model bacterium Bacillus subtilis 168. Dap(R)1 was obtained by serial passages with increasing DAP concentrations, is 30-fold more resistant than the parent strain, and displays cross-resistance to vancomycin, moenomycin, and bacitracin. Dap(R)1 is characterized by aberrant septum placement, notably thickened peptidoglycan at the cell poles, and pleiotropic alterations at both the transcriptome and proteome levels. Genome sequencing of Dap(R)1 revealed 44 point mutations, 31 of which change protein sequences. An intermediate isolate that was 20-fold more resistant to DAP than the wild type had only three of these point mutations: mutations affecting the cell shape modulator gene mreB, the stringent response gene relA, and the phosphatidylglycerol synthase gene pgsA. Genetic reconstruction studies indicated that the pgsA(A64V) allele is primarily responsible for DAP resistance. Allelic replacement with wild-type pgsA restored DAP sensitivity to wild-type levels. The additional point mutations in the evolved strain may contribute further to DAP resistance, serve to compensate for the deleterious effects of altered membrane composition, or represent neutral changes. These results suggest a resistance mechanism by which reduced levels of phosphatidylglycerol decrease the net negative charge of the membrane, thereby weakening interaction with the positively charged Ca(2+)-DAP complex.


Figures

Fig. 1.
Fig. 1.
Fluorescence micrographs of strains 168 and DapR1 stained with DAP-BDP. Wild-type 168 was treated with DAP-BDP at 20 μg/ml (2-fold higher than the MIC) (A) and 200 μg/ml (20-fold higher than the MIC) (C). DapR1 was treated with DAP-BDP at 20 μg/ml (B) and 200 μg/ml (D). Strains 168 and DapR1 show a spotted localization of DAP-BDP and preferential insertion at division septa. Most 168 cells were saturated at 200 μg/ml (C); therefore, the lower DAP-BDP concentration of 20 μg/ml was chosen for quantitative analysis (see Fig. 2). Bar, 2 μm.
Fig. 2.
Fig. 2.
Quantitative analysis of fluorescence intensity distributions in B. subtilis 168 and DapR1 labeled with DAP-BDP. Images of fluorescent cells treated for 10 min with 20 μg/ml DAP-BDP (2-fold higher than the MIC) were analyzed using BHV software (54). Fluorescence intensities (a.f.u.) of the cells were grouped into bins of 300 (x axis). The number of cells in each bin is represented by the frequency (y axis). For wild-type 168 cells, n was 1,029, the average fluorescence intensity was 928 a.f.u., the standard deviation was 663 a.f.u., the minimum fluorescence intensity was −138 a.f.u., and the maximum fluorescence intensity was 5,942 a.f.u. For DapR1 cells, n was 1,044, the average fluorescence intensity was 153 a.f.u., the standard deviation was 192 a.f.u., the minimum fluorescence intensity was −369 a.f.u., and the maximum fluorescence intensity was 1,112 a.f.u. The differences between wild-type 168 and DapR1 labeling are statistically significant, with a two-tailed P value of <0.0001.
Fig. 3.
Fig. 3.
Comparison of DapR1 and 168 transcriptomes. The scatterplot presents average expression levels in untreated mid-log-phase cultures of B. subtilis DapR1 versus 168 for triplicate microarray analyses. The legend lists genes that were strongly or weakly expressed in DapR1 (>2.5-fold), in part grouped by their corresponding transcriptional regulators (a detailed listing can be found in Table S1 in the supplemental material).
Fig. 4.
Fig. 4.
Dual-channel image of the extracellular proteome of DapR1 (red) in comparison to that of 168 (green). B. subtilis strains were grown in LB broth and harvested 1 h after entry into the stationary phase (OD540 = 3.0). Extracellular proteins of the supernatant were precipitated with TCA, separated using 2D-PAGE in the pH range of 3 to 10 (1), and identified using MALDI-TOF mass spectrometry (20). Quantification of the dual-channel image was performed using Decodon Delta 2D software. Proteins with induced ratios in DapR1 compared to 168 are labeled in red. The expression ratios are listed in Table S6 in the supplemental material.
Fig. 5.
Fig. 5.
Schematic illustration of Dap susceptibilities of strain 168, evolved strains, and genetic reconstructions. The indicated strains are either the 168 wild type or DapR20 or DapR1 evolved strains and their derivatives. Introduced alleles are either from the wild type (for the evolved strains) or from the DapR1 evolved strain (as indicated by asterisks). pgsA*, pgsA(A64V); mreB*, mreB(A139V); relA*, relA(R177H). Values represent the MICs, in μg/ml.
Fig. 6.
Fig. 6.
TEM of strains 168 and DapR1 reveals a thicker cell wall at the poles of DapR1 and irregular septum placement. (A) TEM of thinly sliced 168 cells with regular septation and a regular cell wall in the characteristic rod shape of the B. subtilis wild-type strain. (B) TEM of DapR1 cells, with asymmetrical, aberrant septum placement and a thicker cell wall at the cell poles and division septa. Overall, 68% of cells (n = 142) displayed aberrant septa and a thickened cell wall. CW, cell wall; CM, cell membrane; S, septum; P, pole. Bars, 0.1 μm (except for in panel A, bottom left [0.2 μm], and panel B, bottom right [1.0 μm]).

References

    1. Antelmann H., et al. 2001. A proteomic view on genome-based signal peptide predictions. Genome Res. 11:1484–1502 - PubMed
    1. Antelmann H., Yamamoto H., Sekiguchi J., Hecker M. 2002. Stabilization of cell wall proteins in Bacillus subtilis: a proteomic approach. Proteomics 2:591–602 - PubMed
    1. Arnaud M., Chastanet A., Debarbouille M. 2004. New vector for efficient allelic replacement in naturally nontransformable, low-GC-content, gram-positive bacteria. Appl. Environ. Microbiol. 70:6887–6891 - PMC - PubMed
    1. Atrih A., Bacher G., Allmaier G., Williamson M. P., Foster S. J. 1999. Analysis of peptidoglycan structure from vegetative cells of Bacillus subtilis 168 and role of PBP 5 in peptidoglycan maturation. J. Bacteriol. 181:3956–3966 - PMC - PubMed
    1. Barak I., Muchova K., Wilkinson A. J., O'Toole P. J., Pavlendova N. 2008. Lipid spirals in Bacillus subtilis and their role in cell division. Mol. Microbiol. 68:1315–1327 - PMC - PubMed

Publication types

MeSH terms