Comparative Study
. 2011 Aug 1;187(3):1184-91.
doi: 10.4049/jimmunol.1002902. Epub 2011 Jun 27.

TNF receptor 1 mediates dendritic cell maturation and CD8 T cell response through two distinct mechanisms

Affiliations
Comparative Study

TNF receptor 1 mediates dendritic cell maturation and CD8 T cell response through two distinct mechanisms

Xilai Ding et al. J Immunol. .

Abstract

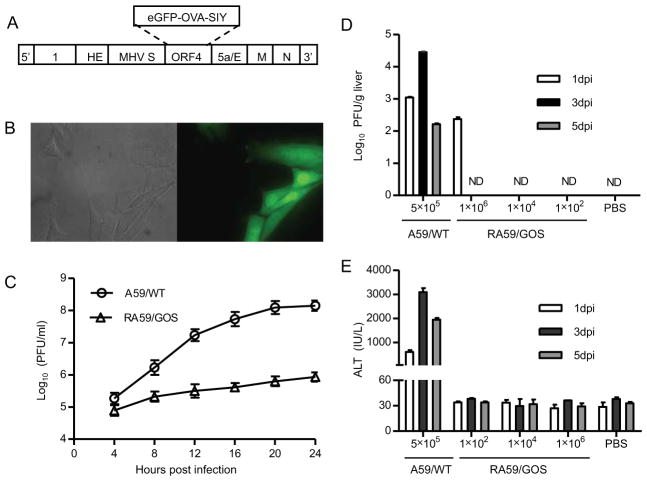
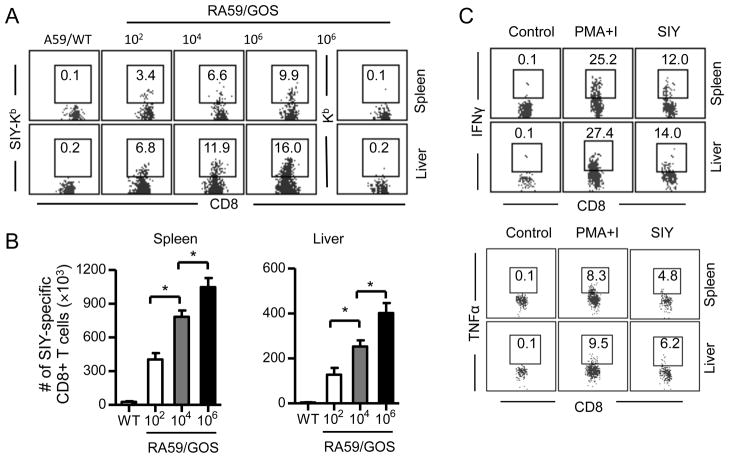
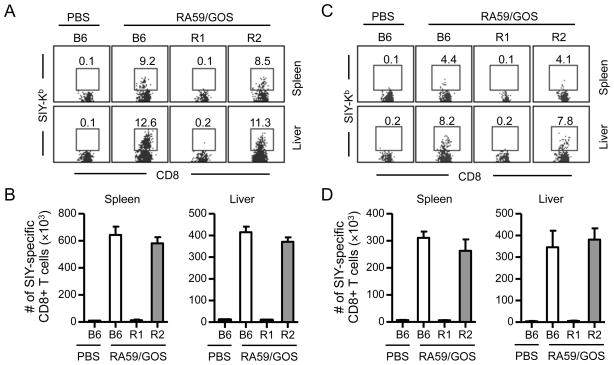
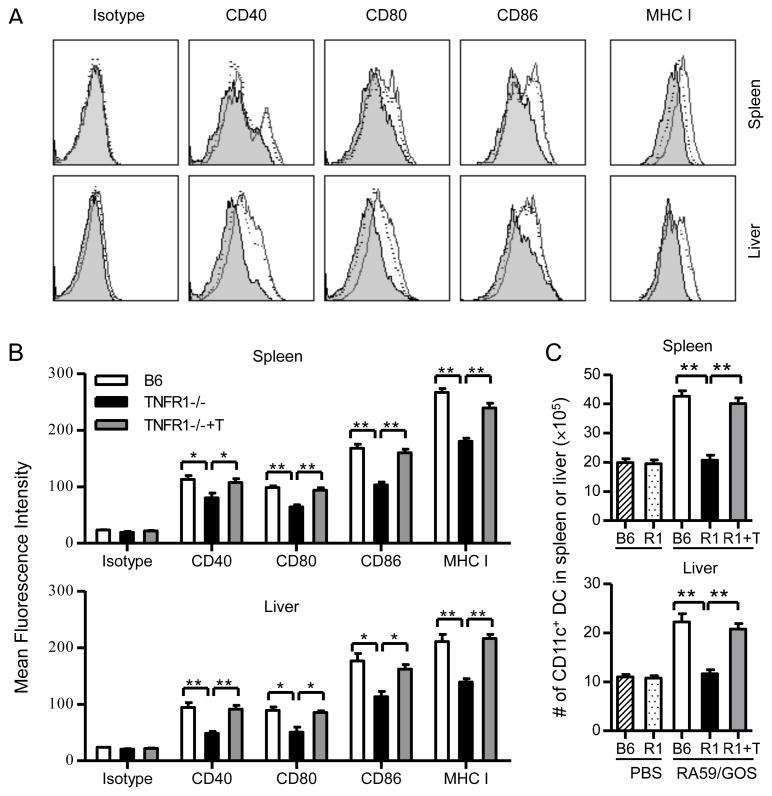
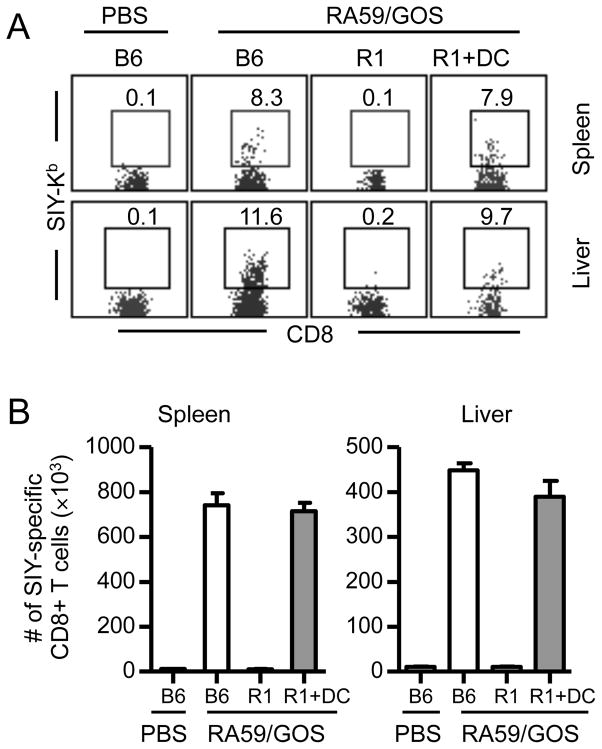
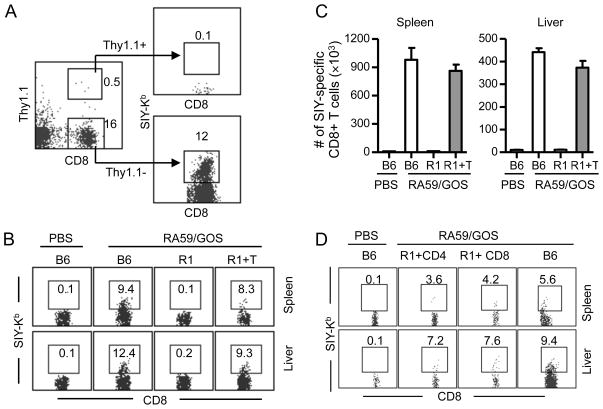
TNF-α and its two receptors (TNFR1 and 2) are known to stimulate dendritic cell (DC) maturation and T cell response. However, the specific receptor and mechanisms involved in vivo are still controversial. In this study, we show that in response to an attenuated mouse hepatitis virus infection, DCs fail to mobilize and up-regulate CD40, CD80, CD86, and MHC class I in TNFR1(-/-) mice as compared with the wild-type and TNFR2(-/-) mice. Correspondingly, virus-specific CD8 T cell response was dramatically diminished in TNFR1(-/-) mice. Adoptive transfer of TNFR1-expressing DCs into TNFR1(-/-) mice rescues CD8 T cell response. Interestingly, adoptive transfer of TNFR1-expressing naive T cells also restores DC mobilization and maturation and endogenous CD8 T cell response. These results show that TNFR1, not TNFR2, mediates TNF-α stimulation of DC maturation and T cell response to mouse hepatitis virus in vivo. They also suggest two mechanisms by which TNFR1 mediates TNF-α-driven DC maturation, as follows: a direct effect through TNFR1 expressed on immature DCs and an indirect effect through TNFR1 expressed on naive T cells.


Figures

FIGURE 1
FIGURE 1. Construction and characterization of recombinant MHV-A59 expressing an eGFP-OVA-SIY fusion protein
(A) Schematic diagram of recombinant MHV virus. Targeted RNA recombination was used to replace ORF4 of MHV-A59 with a sequence encoding eGFP-OVA-SIY fusion protein. The eGFP-OVA-SIY fusion gene was first cloned into pMH54 plasmid via Sal I and Not I sites, and then transcribed into RNA for recombination with feline MHV in AK-D cells. See Materials and Methods for details. (B) eGFP fluorescence of RA59/GOS infected cells. 17Cl-1 cells were seeded on cover glass in 6-well plate followed by RA59/GOS infection at MOI of 1. Eight hours post infection, cells were fixed and visualized by fluorescence microscopy. Bright field and fluorescent images of the same area are shown. (C) Comparison of replication of wild-type and recombinant MHV-A59 in cultured cells. 17Cl-1 cells were infected in triplicates with A59/WT or RA59/GOS at MOI of 1. Culture supernatants were harvested every 4 hrs and assayed for virus titer by plaque assay. The mean virus titer ± standard deviation (SD) of triplicate samples is shown. Representative results from one of three experiments are shown. (D, E) Comparison of virus titers and ALT levels in B6 mice infected with A59/WT or RA59/GOS. B6 mice were inoculated i.p. with A59/WT (5×10⁵ pfu/mouse) or the indicated doses of RA59/GOS. PBS injected mice were used as control. At 1, 3 and 5 dpi, sera and livers were harvested for assaying ALT levels and virus titers, respectively. Virus titers (D) and ALT levels (E) are shown as mean ± SD of 5–6 mice per group. ND, not detectable. Representative results from one of three experiments are shown.
FIGURE 2
FIGURE 2. RA59/GOS induces CD8 T cell responses in a dose dependent manner
Groups of B6 mice were infected i.p. with different doses of RA59/GOS virus or with 5 × 10⁵ pfu of A59/WT virus. Seven dpi, cells from spleen and liver were enumerated and analyzed for CD3, CD8, SIY-Kb and 7AAD (A and B). Alternatively, cells were stimulated with SIY peptide or PMA plus ionomycin (PMA+I) or without any stimulation (Control) for 5 hrs and stained for CD8, SIY-Kb and intracellular IFNγ or TNFα (C). Kb indicates the same stains except that H-2Kb:Ig fusion protein was not loaded with SIY peptide. (A) Representative SIY-Kb (or Kb) versus CD8 staining profiles of CD3+ CD8+ live cells (7AAD) from spleen and liver are shown. The number indicates percentage of SIY-Kb-positive cells among CD8+ cells. (B) Comparison of mean ± SD of SIY-Kb+ CD8+ cells in the spleen (left panel) and liver (right panel) of 4 mice per group. Data from one of two similar experiments are shown. * indicates p value of <0.05. (C) Intracellular staining of IFNγ and TNFα gating on SIY-Kb+ and CD8+ T cells in the spleen and liver. Representative data from two independent experiments are shown.
FIGURE 3
FIGURE 3. Defective CD8 T cell response to RA59/GOS in TNFR1-deficient mice
(A, B) B6, TNFR1−/− (R1) and TNFR2−/− (R2) mice were inoculated i.p. with 1 × 10⁶ pfu of RA59/GOS or the same volume of PBS. Seven dpi, cells from spleen and liver were enumerated and analyzed for CD3, CD8, SIY-Kb and 7AAD as in Fig. 2. (A) Representative SIY-Kb versus CD8 staining profiles of CD3+ CD8+ live cells from spleen and liver. (B) Comparison of mean ± SD of SIY-Kb+ CD8+ cells in the spleen and liver of 4 mice per group. Combined data from two experiments are shown. (C, D) B6, TNFR1−/− and TNFR2−/− mice were infected and analyzed as in A and B, except analysis was done 11 dpi. Data shown are from 3–4 mice per group.
FIGURE 4
FIGURE 4. DC maturation and mobilization is impaired in TNFR1-deficient mice and the impaired DC response is restored by adoptive transfer of TNFR1-positive T cells
B6 mice, TNFR1−/− mice and TNFR1−/− mice that were transferred with purified CD3+ T cells (TNFR1−/−+T or R1+T) one day earlier were inoculated with 1 × 10⁶ pfu of RA59/GOS virus or the same volume of PBS. Three days later, cells from spleen and liver were enumerated and analyzed for CD11c plus CD40, CD80, CD86 or MHC class I. (A) Comparison of CD40, CD80, CD86 and MHC I expression by CD11c+ cells from B6 mice (histograms with solid lines), TNFR1−/− mice (shaded histograms), and TNFR1−/− mice injected with T cells (histograms with dotted lines). (B) Comparison of mean fluorescence intensity (MFI) of CD40, CD80, CD86, and MHC I by CD11c+ cells from the spleen (upper panel) or liver (lower panel) from B6 mice, TNFR1−/− mice, and TNFR1−/− mice injected with T cells. (C) Comparison of the total numbers of CD11c+ cells in the spleen (upper panel) and liver (lower panel) of B6 mice, TNFR1−/− mice (R1), and TNFR1−/− mice injected with T cells (R1+T). * p< 0.05; ** p< 0.01.
FIGURE 5
FIGURE 5. Rescue of CD8 T cell response in TNFR1-deficient mice by adoptive transfer of TNFR1-expressing DCs
Bone marrow cells from B6 mice were cultured in the presence of GM-CSF for 7 days. DCs (75% CD11c+) were injected intravenously into TNFR1−/− mice (R1+DC, 8 × 10⁵ per recipient). One day later, mice were infected with 1 × 10⁶ pfu of RA59/GOS virus and the frequency and the number of SIY-specific CD8 T cells were analyzed in the spleen and liver at 7 dpi as in Fig. 2. (A) Representative SIY-Kb versus CD8 staining profiles of CD3+ CD8+ cells from spleen and liver. (B) Comparison of mean ± SD of SIY-Kb+ CD8+ cells in the spleen and liver of 4 mice per group. Data shown are from one of two independent experiments.
FIGURE 6
FIGURE 6. Rescue of CD8 T cell response in TNFR1-deficient mice by adoptive transfer of TNFR1-expressing T cells
Total, CD4+ and CD8+ T cells (>95% CD3+) were purified from lymph nodes of B6 mice (Thy1.1+) and injected intravenously into TNFR1−/− mice (R1+T, 5–8 × 10⁶ per recipient). One day later, mice were infected with 1 × 10⁶ pfu of RA59/GOS virus and 7 dpi cells from spleen and liver were enumerated and analyzed for Thy1.1, CD8, and SIY-Kb. (A) Representative Thy1.1 versus CD8 staining profiles of live cells from liver. Note, very few transferred T cells (Thy1.1+) were positive for SIY-Kb. (B) Representative SIY-Kb versus CD8 staining profiles of endogenous (Thy1.1) CD8+ cells from spleen and liver as gated in A. The number indicates percentage of cells in the gated regions. R1, TNFR1−/− mice; R1+T, TNFR1−/− mice transferred with purified total T cells. (C) Comparison of mean ± SD of SIY-Kb+ CD8+ Thy1.1 endogenous T cells in the spleen and liver of B6 mice, TNFR1−/− mice and TNFR1−/− mice transferred with total T cells. (D) Representative SIY-Kb versus CD8 staining profiles of endogenous (Thy1.1) CD8+ cells from spleen and liver as gated in A. The number indicates percentage of cells in the gated regions. R1+CD4, TNFR1−/− mice transferred with purified CD4 T cells; R1+CD8, TNFR1−/− mice transferred with purified CD8 T cells. Data shown are from one of two independent experiments with 4 mice per group per experiment.

References

    1. Davis MM, Bjorkman PJ. T-cell antigen receptor genes and T-cell recognition. Nature. 1988;334:395–402. - PubMed
    1. Sharpe AH, Freeman GJ. The B7-CD28 superfamily. Nat Rev Immunol. 2002;2:116–126. - PubMed
    1. Chen L. Co-inhibitory molecules of the B7-CD28 family in the control of T-cell immunity. Nat Rev Immunol. 2004;4:336–347. - PubMed
    1. Matsuno K, Ezaki T, Kudo S, Uehara Y. A life stage of particle-laden rat dendritic cellsin vivo: their terminal division, active phagocytosis, and translocation from the liver to the draining lymph. J Exp Med. 1996;183:1865–1878. - PMC - PubMed
    1. Flores-Romo L. In vivo maturation and migration of dendritic cells. Immunology. 2001;102:255–262. - PMC - PubMed

Publication types

MeSH terms

Substances