. 2011 Jul 12;108(28):11680-5.
doi: 10.1073/pnas.1019622108. Epub 2011 Jun 27.

Sugar-regulated cation channel formed by an insect gustatory receptor

Affiliations

Sugar-regulated cation channel formed by an insect gustatory receptor

Koji Sato et al. Proc Natl Acad Sci U S A. .

Abstract

Insects sense the taste of foods and toxic compounds in their environment through the gustatory system. Genetic studies using fruit flies have suggested that putative seven-transmembrane gustatory receptors (Grs) expressed in gustatory sensory neurons are required for responses to specific tastants. We reconstituted sugar responses of Bombyx mori Gr-9 (BmGr-9), a silkworm Gr, in two heterologous expression systems. Xenopus oocytes or HEK293T cells expressing BmGr-9 selectively responded to D-fructose with an influx of extracellular Ca(2+) and a nonselective cation current conductance in a G protein-independent manner. Outside-out patch-clamp recording of BmGr-9-expressing cell membranes provides evidence supporting the hypothesis that BmGr-9 constitutes a ligand-gated ion channel. The fructose-activated current associated with BmGr-9 was suppressed by other hexoses, including glucose and sorbose. The activation and inhibition of insect Gr ion channels may be the molecular basis for the decoding system that discriminates subtle differences in sweet taste. Finally, Drosophila melanogaster Gr43a (DmGr43a), a BmGr-9 ortholog, also responded to D-fructose, suggesting that DmGr43a relatives appear to compose the family of fructose receptors.


Conflict of interest statement

The authors declare no conflict of interest.

Figures

Fig. 1.
Fig. 1.
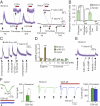
d-Fructose is a ligand for a B. mori gustatory receptor, BmGr-9, and a D. melanogaster gustatory receptor, DmGr43a. (A) The current traces recorded from BmGr-9–expressing Xenopus oocytes or control oocyte (no injection) with sequential application of various sweeteners at the holding potential of −80 mV. Tastants were applied for 3 s at the time indicated by arrowheads. All compounds were tested at 100 mM. The data are representative of recordings from ten oocytes. (B) The BmGr-9 current was dependant on the dose of d-fructose. (Upper) The current responded to application of the indicated concentrations of d-fructose. d-Fructose was sequentially applied for 3 s to the same oocyte at the time points indicated by the red arrowheads. (Lower) Dose–response curve of BmGr-9. The curve was fitted to the Hill equation (n = 6; EC50 = 55.5 mM, Hill coefficient = 1.02). (C) Current-voltage (I–V) relationships resulting from treatments with several concentrations of d-fructose. The data are representative of recordings from four oocytes. (D) Dose-dependent Ca2+ responses of HEK293T cells expressing BmGr-9 to d-fructose. The pseudocolored images demonstrate the changes in Fura-2 fluorescence with increasing concentrations of d-fructose where red indicates a cell that shows the greatest response. The chart shows average Fura-2–based Ca2+ responses to increasing concentrations of d-fructose (n = 34), and the bar indicates the timing of stimulation. (E) Dose–response curve of BmGr-9 to d-fructose based on quantitative analysis of Ca2+ imaging. The curve was fitted to the Hill equation (n = 159; EC50 = 35 mM, Hill coefficient = 1.62). (F) Average Fura-2–based Ca2+ responses of COS-7 cells expressing DmGr43a with application of 1 and 10 mM d-fructose (n = 10). The shaded region around the trace represents SEM.
Fig. 2.
Fig. 2.
Characterization of d-fructose–stimulated Ca2+ and electric signals in BmGr-9–expressing HEK293T cells. (A) Average Ca2+ responses of BmGr-9–expressing HEK293T cells (n = 29; Left) or vector (n = 29; Right) to 100 mM d-fructose (20-s stimulation) in the presence or absence of 10 mM EGTA (red bar). (B) Quantification of response amplitudes of d-fructose–stimulated Ca2+ responses in A. (C) Average Ca2+ responses of HEK293T cells expressing BmGr-9 plus α1-adrenergic receptor (AR) to 100 mM d-fructose (20-s stimulation) or to 100 nM norepinephrine (5-s stimulation) before and after application of 10 μM U73122 (blue bar) (n = 7). (D) Quantification of cAMP in HEK293T cells expressing mOR-EG or BmGr-9 stimulated with eugenol (1 mM) or various concentrations of d-fructose (from 1 to 300 mM), respectively (n = 4, mean ± SEM). (E) Average Ca2+ responses of HEK293T cells expressing BmGr-9 to d-fructose (100 mM), 8-bromo-cAMP (1 mM), 8-bromo-cGMP (1 mM), and forskolin (5 μM) (20-s application) (n = 18). (F) Effect of GDP-βS on ligand-induced whole-cell currents in HEK 293T cells (each: n = 11–13). (Left panels) Arrowheads indicate the timing of the 20-s carbachol application to vector-transfected HEK293T cells. (Right panels) Arrows indicate the timing of the 1-s d-fructose application to BmGr-9–transfected HEK293T cells. Recording was performed in the presence (blue trace) or absence (green trace) of 2 mM GDP-βS in the electrode. Red bar indicates the timing of GDP-βS application (whole-cell mode configuration). Significance was assessed by t test or ANOVA and Fisher's protected least squares difference: *P < 0.05, ***P < 0.001. Error bars and shaded regions around the Ca2+ response traces represent SEM.
Fig. 3.
Fig. 3.
BmGr-9 forms a d-fructose–activated cation channel. (A) A whole-cell current recorded from a HEK293T cell expressing BmGr-9 upon stimulation with 1 or 100 mM d-fructose for 200 ms. (B) Onset of BmGr-9–mediated inward current in response to d-fructose stimulus of increasing duration as indicated by the different colors. (C) Current response of a HEK293T cell expressing BmGr-9 (10 or 100 mM d-fructose at various holding potentials). Top traces indicate onset of stimulation. (Left) Blue shows a cell with strong inward rectification, and (Right) green shows a cell without rectification. (Right) IV relationship with the respective peak current of each response in Left panel plotted. (D) A whole-cell current recorded from a COS-7 cell expressing DmGr43a upon stimulation with 100 mM d-fructose for 2 s (first application) or 5 s (second and third applications). (Right) I–V relationship. (E) Reversal potentials of whole-cell current responses of HEK293T cells expressing BmGr-9 [100 mM d-fructose resulting from different cation compositions in the recording solution (each: n = 7–24)]. Ion and reagents in the external (Ext.) and internal (Int.) solutions are indicated at the bottom. (F) Effect of ruthenium red at a holding potential of +80 and −60 mV on the whole-cell current response of a HEK293T cell expressing BmGr-9. The timing of 100 mM d-fructose and 50 μM ruthenium red application is indicated by white and red bars, respectively. (G) Excised outside-out patch-clamp recording of BmGr-9 currents measured in a HEK293T cell membrane. The top trace shows the timing of the addition of 100 mM d-fructose. All-point current histograms (bottom) were obtained from the region indicated on a trace of first stimulation by the green bar before stimulation (green histogram, left) and by the blue bar during stimulation (blue histogram, right). (Right) Recording of an untransfected cell membrane. Mean peak current levels were obtained from the fitted Gaussians.
Fig. 4.
Fig. 4.
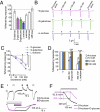
Inhibition of BmGr-9–mediated currents by hexoses. (A) The d-fructose–evoked whole-cell currents recorded from BmGr-9–expressing Xenopus oocytes were inhibited by coapplication of 300 mM sweeteners (n = 6, mean ± SEM). (B) Dose-dependent inhibition of d-fructose–evoked inward currents in BmGr-9–expressing Xenopus oocytes by d-glucose, d-galactose, or l-sorbose. Current traces upon 3 s application of a mixture of 10 mM d-fructose and the indicated concentration of d-glucose (magenta trace), d-galactose (green trace), or l-sorbose (blue trace); the inhibitors were added at the time points indicated by the arrowheads. (C) Quantification of dose-dependent inhibition (n = 7, mean ± SEM). (D) The inhibition associated with 300 mM d-glucose or l-sorbose can be overcome in BmGr-9–expressing oocytes by increasing the concentration of d-fructose to 30 mM (blue bar) or 100 mM (brown bar) (n = 4, mean ± SEM). (E) Current traces of a BmGr-9–expressing HEK293T cell upon application of 100 mM d-fructose (open bar) or 300 mM d-glucose (magenta bar) (F) Onset of inward current in a BmGr-9–expressing HEK293T cell to d-fructose in the presence (magenta trace) or absence (black trace) of 300 mM d-glucose; the competitor was added at the time point indicated by the open bar. Significance was assessed by the t test: *P < 0.05, **P < 0.01, ***P < 0.001. The holding potential was −80 mV (Xenopus oocytes) and −60 mV (HEK293T).

References

    1. Clyne PJ, Warr CG, Carlson JR. Candidate taste receptors in Drosophila. Science. 2000;287:1830–1834. - PubMed
    1. Honeybee Genome Sequencing Consortium Insights into social insects from the genome of the honeybee Apis mellifera. Nature. 2006;443:931–949. - PMC - PubMed
    1. Hill CA, et al. G protein-coupled receptors in Anopheles gambiae. Science. 2002;298:176–178. - PubMed
    1. Wanner KW, Robertson HM. The gustatory receptor family in the silkworm moth Bombyx mori is characterized by a large expansion of a single lineage of putative bitter receptors. Insect Mol Biol. 2008;17:621–629. - PubMed
    1. Ueno K, et al. Trehalose sensitivity in Drosophila correlates with mutations in and expression of the gustatory receptor gene Gr5a. Curr Biol. 2001;11:1451–1455. - PubMed

Publication types

MeSH terms

Associated data