. 2011 Jul 12;108(28):11429-34.
doi: 10.1073/pnas.1010481108. Epub 2011 Jun 27.

Membrane tension regulates motility by controlling lamellipodium organization

Affiliations

Membrane tension regulates motility by controlling lamellipodium organization

Ellen L Batchelder et al. Proc Natl Acad Sci U S A. .

Abstract

Many cell movements proceed via a crawling mechanism, where polymerization of the cytoskeletal protein actin pushes out the leading edge membrane. In this model, membrane tension has been seen as an impediment to filament growth and cell motility. Here we use a simple model of cell motility, the Caenorhabditis elegans sperm cell, to test how membrane tension affects movement and cytoskeleton dynamics. To enable these analyses, we create transgenic worm strains carrying sperm with a fluorescently labeled cytoskeleton. Via osmotic shock and deoxycholate treatments, we relax or tense the cell membrane and quantify apparent membrane tension changes by the membrane tether technique. Surprisingly, we find that membrane tension reduction is correlated with a decrease in cell displacement speed, whereas an increase in membrane tension enhances motility. We further demonstrate that apparent polymerization rates follow the same trends. We observe that membrane tension reduction leads to an unorganized, rough lamellipodium, composed of short filaments angled away from the direction of movement. On the other hand, an increase in tension reduces lateral membrane protrusions in the lamellipodium, and filaments are longer and more oriented toward the direction of movement. Overall we propose that membrane tension optimizes motility by streamlining polymerization in the direction of movement, thus adding a layer of complexity to our current understanding of how membrane tension enters into the motility equation.


Conflict of interest statement

The authors declare no conflict of interest.

Figures

Fig. 1.
Fig. 1.
tagRFP-T∷MSP is expressed exclusively in sperm cells and is competent for polymerization. (A) A worm expressing MSP-142 N-terminally fused with tagRFP-T driven by the spe-11 promoter. (Left) Transmitted light image; (Right) epifluorescence image. O, oocyte; G, gonad arm; S, spermatheca, and E, fertilized embryo. Fluorescence is seen only in the spermatheca, where sperm cells are stored. (B) A representative field of active and inactive sperm cells containing tagRFP-T∷MSP driven by the spe-11 promotor (Left) and the peel-1 promotor (Right). In inactive round sperm cells, fluorescence is uniform (arrows), whereas in activated cells, fluorescence is concentrated in the lamellipodia and displays bright patches (arrowheads) or is visible as a cortex near the plasma membrane (asterisk, peel-1 strains only). (C) Typical analysis of flows and movement of sperm cells by kymograph analysis. Kymographs were created from a line drawn on the long axis of the cell near the center. (Top) Still images of a crawling cell and associated kymograph. The position of the cell body is indicated by the white dotted line, and the time on the last panel is the total elapsed time. (Bottom) Still images of a stationary cell and associated kymograph. Arrowheads point to features undergoing retrograde flow toward the cell body and producing streaks in the kymographs. Examples of retrograde flow and movement lines are indicated on the kymographs. In A and B , bar=5 μm. In C, vertical scale bar=5 μm, and horizontal scale bar = 20 s.
Fig. 2.
Fig. 2.
Effect of membrane tension on sperm cell motility. (A) Dot plots of the speed of whole cell translocation. Red: hypotonic medium (130 mOsm); blue: isotonic media (175 mOsm); green: 150 μm deoxycholate (DC); purple: hypertonic media (275 mOsm); black: strong hypertonic media (350 mOsm). Significant differences are marked with asterisks. (B) Dot plots of the spread area of crawling cells and their aspect ratio (lamellipodium long axis divided by cell body width) under different treatments with labels and color coding as in A. Significant differences are marked with asterisks. (C) The relation of tether force (+/− SEM) to cell treatment. Legend is as for A. Seven to 18 cells were measured per condition, and tether forces were recorded as soon as the force stabilized (10–30 s), before tube relaxation could set in. The difference between Iso and DC/Hyper/Hyper++ is significant (marked with an asterisk for DC only). (Left) A tube (arrowhead) extending between the bead (Top) and the lamellipodia of a pronase-activated sperm cell (Bottom). The sperm cell is out of focus. (D) Tube under flow experiment to evaluate effect of hypotonic treatment on short time scales. A tube was pulled at time zero and 10 s later, water began to be injected (red curve, arrowhead) or not (blue curve). Evolution of the tether force was recorded over time and reproducibly showed a spike after water injection (red curve, arrow) before relaxing, whereas tubes of control cells just relaxed (blue curve). In C, bar = 2 μm.
Fig. 3.
Fig. 3.
The effect of membrane tension on retrograde flow and apparent polymerization rates. (A) Dot plots of speeds of retrograde flow (absolute values) during cell translocation. Red: hypotonic medium (130 mOsm); blue: isotonic media (175 mOsm); green: 150 μm DC; purple: hypertonic media (275 mOsm); black: strong hypertonic media (350 mOsm). (B) Polymerization speed under conditions as in A. (Left) Movement plus retrograde flow speeds (absolute values) for crawling cells. (Right) Retrograde flow speeds of stationary cells (absolute values). All differences in stationary retrograde flow values are significant (marked with an asterisk). The sum values give the same trend as the stationary retrograde flow values. (C) Transmitted light kymograph of a representative cell that transitions between translocating and stationary behaviors. [Features observable by transmitted light correspond to fluorescent MSP structures and show comparable dynamics (Fig. S2).] (Left) Normal kymograph, (Right) kymograph taken from the same cell but with the cell bodies aligned using a MatLab script. Example kymograph slopes drawn in red. Vertical scale bar = 5 μm, and horizontal scale bar = 15 s.
Fig. 4.
Fig. 4.
Tension controls lamellipodial organization in 3D. (A) A confocal slice showing the plasma membrane labeling under different conditions of membrane tension. Hypo: hypotonic media (130 mOsm); Iso: isotonic media (175 mOsm); DC: 150 μm deoxycholate; Hyper++: strong hypertonic media (350 mOsm). (B) Overlay of 10 typical contours derived from XZ planes as described in Materials and Methods under conditions as in A. The inner concentric circle is at 1 μm and the outer circle is at 4 μm. (C) Roughness of lamellipodial contours under conditions as in A, with red: hypotonic medium; blue: isotonic media; green: 150 μm deoxycholate; black: strong hypertonic media. The roughness of the cell body under isotonic conditions is shown in blue -x- symbols. Roughness is represented as the percent of the total area involved in protrusions or invaginations that depart from the equivalent ellipse that matches the contour (see Materials and Methods). Significant differences are marked with asterisks. Cell body roughness under different tension conditions were not significantly different (Fig. S3) so only the isotonic data are shown. (D) MSP fiber visualization under different membrane tension conditions. Labels as in A. Images were denoised with the Safir program (see Materials and Methods). The lengths and angles of the fibers were measured for 20 such cells per condition to generate the data shown in E, G, and H. (E) Absolute values of fiber angles with respect to the long axis of the lamellipodium (defined as 0°) were averaged to give the average fiber angle (θ) per cell shown in dot-plot format. Color coding as in C. Asterisks mark significantly different populations. (F) Cartoon of a sperm cell with fibers as thick gray lines. Polymerization and depolymerization zones are delineated by blue and red dashed lines, respectively. The apparent polymerization speed (formula image
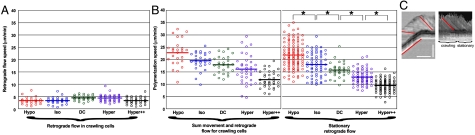
, red arrow) corresponds to the projection (dotted line) of the polymerization flux (vp, black arrow) along the cell axis and decreases with increasing filament misalignment (angle θ) according to the relation 〈vapp〉 = vp〈 cos θ〉. The energy cost of membrane deformation around finger-like protrusions is reduced when neighboring protrusions align with one another (see text). (G) Plot of average apparent polymerization speeds versus average cos θ under four membrane tension conditions. All values +/− SD. The linear correlation is 0.97, with Hyper++ on the curve upon full extrapolation of the error bars in both the x and y directions. (H) Plot of average filament length versus average cos θ under four membrane tension conditions. All values +/− SD. All length differences between the different conditions are significantly different. The linear correlation is 0.97. In A and D, bar = 5 μm.

Similar articles

Cited by

References

    1. Pollard TD, Borisy GG. Cellular motility driven by assembly and disassembly of actin filaments. Cell. 2003;112:453–465. - PubMed
    1. Mogilner A, Oster G. Cell motility driven by actin polymerization. Biophys J. 1996;71:3030–3045. - PMC - PubMed
    1. Raucher D, Sheetz MP. Cell spreading and lamellipodial extension rate is regulated by membrane tension. J Cell Biol. 2000;148:127–136. - PMC - PubMed
    1. Sepsenwol S, Ris H, Roberts TM. A unique cytoskeleton associated with crawling in the amoeboid sperm of the nematode Ascaris suum. J Cell Biol. 1989;108:55–66. - PMC - PubMed
    1. Nelson GA, Roberts TM, Ward S. Caenorhabditis elegans spermatozoan locomotion: Amoeboid movement with almost no actin. J Cell Biol. 1982;92:121–131. - PMC - PubMed

Publication types

MeSH terms

LinkOut - more resources