

A comparison of pain level and entropy changes following core stability exercise intervention
- PMID: 21709629
- PMCID: PMC3539569
- DOI: 10.12659/msm.881846
A comparison of pain level and entropy changes following core stability exercise intervention
Abstract
Background: As reported in our previous studies, the complexity of physiologic time series is a sensitive measure of muscle fatigability. This study compared the differences between 2 different analyses following 4 weeks of core stability exercises (CSE) in subjects with and without chronic low back pain (LBP). We examined whether the observed Shannon (information) entropy, as compared with median frequency (MF), was able to differentiate fatigability of the thoracic and lumbar parts of the erector spinae (ES) muscles following the intervention.
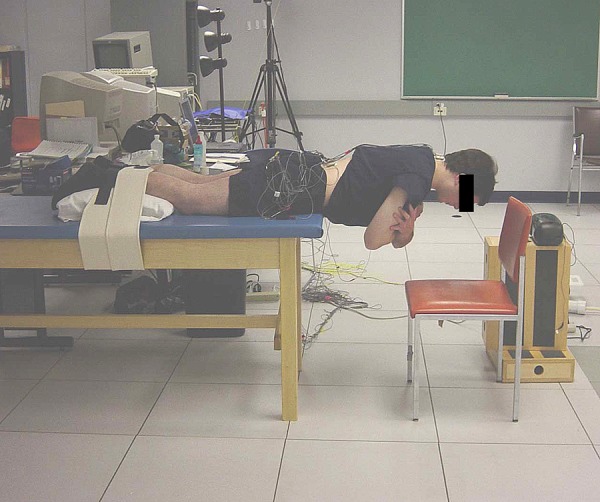
Material/methods: In total, 32 subjects participated in this study. There were 13 subjects in the CSE intervention group (average age 50.4 ± 9.1 years) and 19 subjects in the control group (average age 46.6 ± 9.1 years). The CSE group performed the specific exercise intervention, but the control group was asked to maintain their current activity and/or exercise levels. The endurance of the back muscles was determined by using a modified version of the isometric fatigue test as originally introduced by Sorensen.
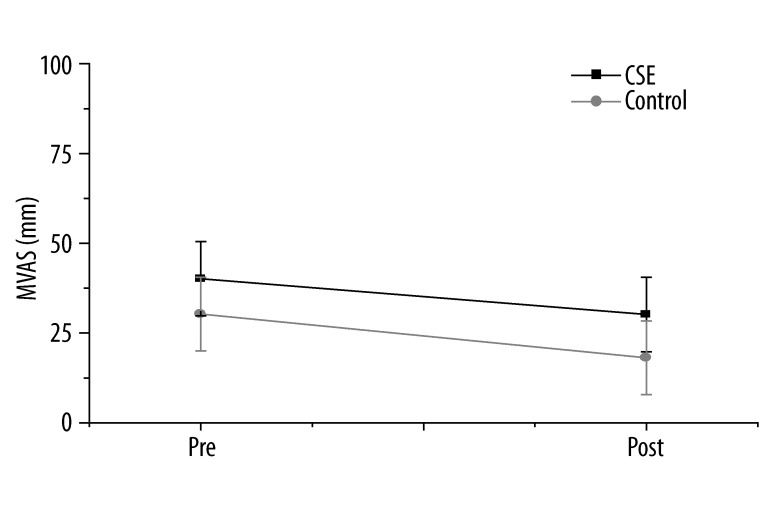
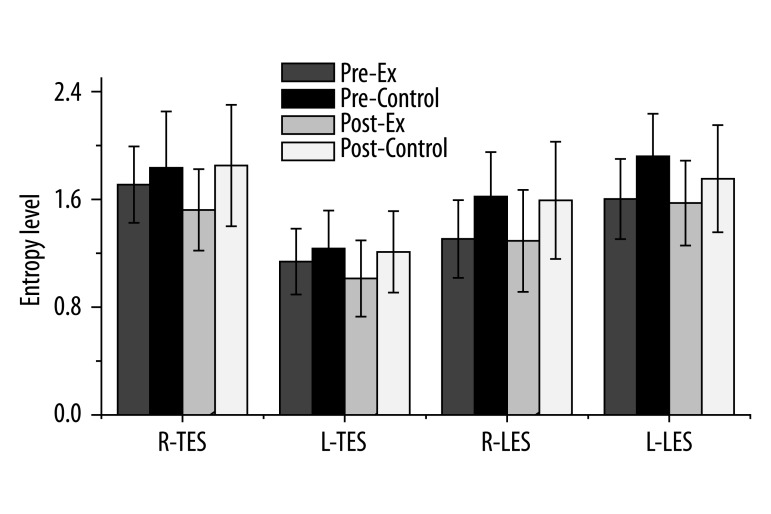
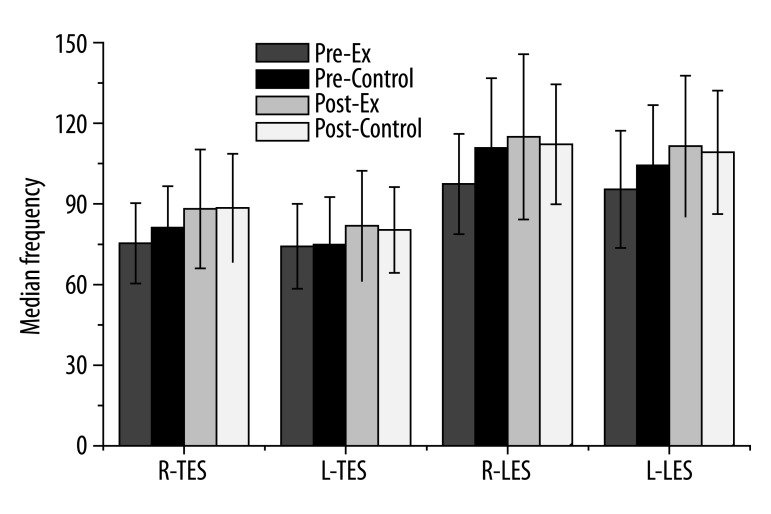
Results: Pain level decreased significantly for all subjects (F=25.29, p=0.001), but there was no difference between groups (F=0.42, p=0.52). The MF was not different between groups following treatment (F=0.81, p=0.37). Although there was no entropy level changes following treatment (F=0.01, p=0.93), the interactions between muscles and groups following treatment were significant (F=7.25, p=0.01). The entropy level decreased in both thoracic ES muscles following intervention in the exercise group, while remaining the same in the control group.
Conclusions: Although the change in pain level was not different between groups, the Shannon entropy measure more sensitively differentiated the exercise intervention than did MF. In addition, the results also suggested that complexity is related to muscle fatigue, which corresponds to the values of entropy between groups. Further studies are needed to investigate the effectiveness of nonlinear time series of EMG data for fatigability.
Figures
Similar articles
-
Spectral and entropy changes for back muscle fatigability following spinal stabilization exercises.J Rehabil Res Dev. 2010;47(2):133-42. doi: 10.1682/jrrd.2009.07.0088. J Rehabil Res Dev. 2010. PMID: 20593326 Clinical Trial.
-
Different parts of erector spinae muscle fatigability in subjects with and without low back pain.Spine J. 2009 Feb;9(2):115-20. doi: 10.1016/j.spinee.2007.11.011. Epub 2008 Feb 14. Spine J. 2009. PMID: 18280212
-
Disability and back muscle fatigability changes following two therapeutic exercise interventions in participants with recurrent low back pain.Med Sci Monit. 2013 Jan 14;19:40-8. doi: 10.12659/msm.883735. Med Sci Monit. 2013. PMID: 23314589 Free PMC article. Clinical Trial.
-
The assessment of back muscle capacity using intermittent static contractions. Part I - Validity and reliability of electromyographic indices of fatigue.J Electromyogr Kinesiol. 2008 Dec;18(6):1006-19. doi: 10.1016/j.jelekin.2007.03.012. Epub 2007 Jul 20. J Electromyogr Kinesiol. 2008. PMID: 17643316 Review.
-
The Effectiveness of Hollowing and Bracing Strategies With Lumbar Stabilization Exercise in Older Adult Women With Nonspecific Low Back Pain: A Quasi-Experimental Study on a Community-based Rehabilitation.J Manipulative Physiol Ther. 2018 Jan;41(1):1-9. doi: 10.1016/j.jmpt.2017.06.012. Epub 2017 Dec 16. J Manipulative Physiol Ther. 2018. PMID: 29254626 Review.
Cited by
-
Investigation of innervation zone shift with continuous dynamic muscle contraction.Comput Math Methods Med. 2013;2013:174342. doi: 10.1155/2013/174342. Epub 2013 Jun 3. Comput Math Methods Med. 2013. PMID: 23762179 Free PMC article.
-
A randomized controlled trial to determine the effect of spinal stabilization exercise intervention based on pain level and standing balance differences in patients with low back pain.Med Sci Monit. 2012 Mar;18(3):CR174-81. doi: 10.12659/msm.882522. Med Sci Monit. 2012. PMID: 22367128 Free PMC article. Clinical Trial.
-
Dose-response-relationship of stabilisation exercises in patients with chronic non-specific low back pain: a systematic review with meta-regression.Sci Rep. 2020 Oct 9;10(1):16921. doi: 10.1038/s41598-020-73954-9. Sci Rep. 2020. PMID: 33037280 Free PMC article.
-
[Difference analysis of muscle fatigue during the exercises of core stability training].Sheng Wu Yi Xue Gong Cheng Xue Za Zhi. 2017 Apr 25;34(2):227-232. doi: 10.7507/1001-5515.201604019. Sheng Wu Yi Xue Gong Cheng Xue Za Zhi. 2017. PMID: 29745578 Free PMC article. Chinese.
-
Determinants of outcomes for patients with chronic low back pain and fear-avoidance beliefs following treatment with specific stabilisation exercises.J Back Musculoskelet Rehabil. 2024;37(4):1059-1069. doi: 10.3233/BMR-230312. J Back Musculoskelet Rehabil. 2024. PMID: 38217583 Free PMC article.
References
-
- Frymoyer JW, Cats-Baril WL. An overview of the incidences and costs of low back pain. Orthop Clin North Am. 1991;22(2):263–71. - PubMed
-
- Arokoski JP, et al. Back and abdominal muscle function during stabilization exercises. Arch Phys Med Rehabil. 2001;82(8):1089–98. - PubMed
-
- Kaufman M, Zurcher U, Sung P. Entropy of Electromyography Time Series. Physica A Statistical Mechanics and its Applications. 2007;386(2):698–707.
-
- Sung PS, Zurcher U, Kaufman M. Nonlinear analysis of electromyography time series as a diagnostic tool for low back pain. Med Sci Monit. 2005;11(1):CS1–5. - PubMed
-
- Sung PS, Zurcher U, Kaufman M. Comparison of spectral and entropic measures for surface electromyography time series: A pilot study. J Rehabil Res Dev. 2007;44(4):599–610. - PubMed
Publication types
MeSH terms
LinkOut - more resources
Full Text Sources
Research Materials
Miscellaneous
