

Semi-automated Algorithm for Localization of Dermal/ Epidermal Junction in Reflectance Confocal Microscopy Images of Human Skin
- PMID: 21709746
- PMCID: PMC3120112
- DOI: 10.1117/12.875392
Semi-automated Algorithm for Localization of Dermal/ Epidermal Junction in Reflectance Confocal Microscopy Images of Human Skin
Abstract
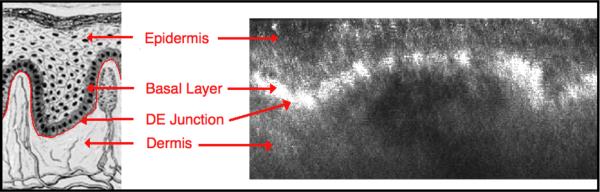
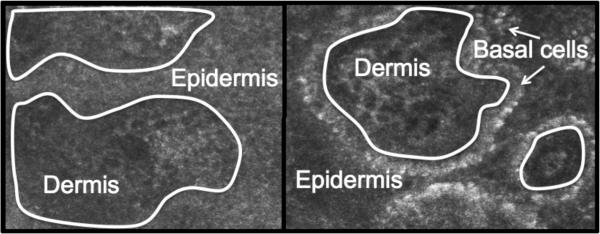
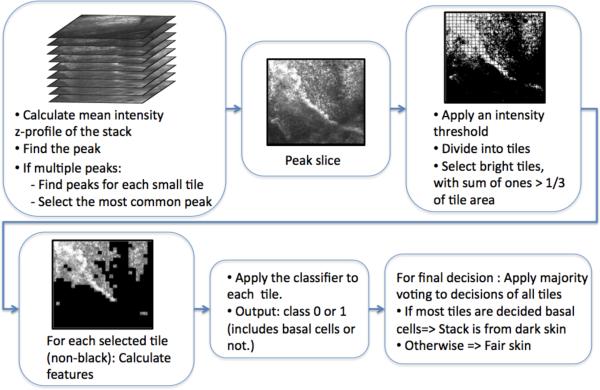
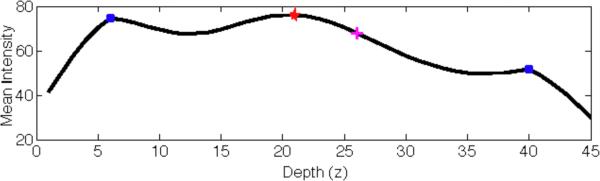
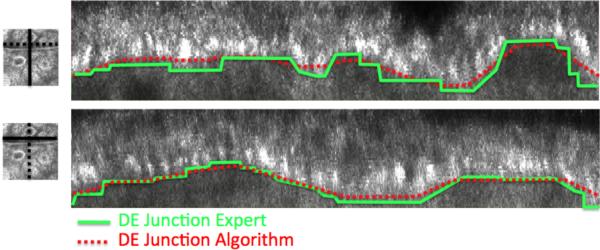
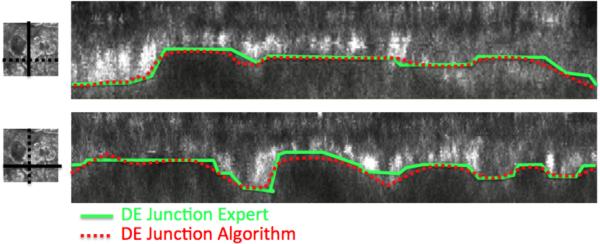
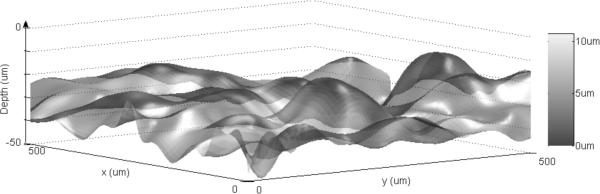
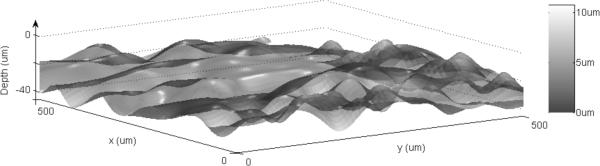
The examination of the dermis/epidermis junction (DEJ) is clinically important for skin cancer diagnosis. Reflectance confocal microscopy (RCM) is an emerging tool for detection of skin cancers in vivo. However, visual localization of the DEJ in RCM images, with high accuracy and repeatability, is challenging, especially in fair skin, due to low contrast, heterogeneous structure and high inter- and intra-subject variability. We recently proposed a semi-automated algorithm to localize the DEJ in z-stacks of RCM images of fair skin, based on feature segmentation and classification. Here we extend the algorithm to dark skin. The extended algorithm first decides the skin type and then applies the appropriate DEJ localization method. In dark skin, strong backscatter from the pigment melanin causes the basal cells above the DEJ to appear with high contrast. To locate those high contrast regions, the algorithm operates on small tiles (regions) and finds the peaks of the smoothed average intensity depth profile of each tile. However, for some tiles, due to heterogeneity, multiple peaks in the depth profile exist and the strongest peak might not be the basal layer peak. To select the correct peak, basal cells are represented with a vector of texture features. The peak with most similar features to this feature vector is selected. The results show that the algorithm detected the skin types correctly for all 17 stacks tested (8 fair, 9 dark). The DEJ detection algorithm achieved an average distance from the ground truth DEJ surface of around 4.7μm for dark skin and around 7-14μm for fair skin.
Figures
References
-
- Gloster H, Brodland DG. The epidemiology of skin cancer. British Journal of Dermatology. 2008;22:217–226. - PubMed
-
- Vestergaard M, Macaskill P, Holt P, Menzies S. Dermoscopy compared with naked eye examination for the diagnosis of primary melanoma: a meta-analysis of studies performed in a clinical setting. British Journal of Dermatology. 2008;159(3):669–676. - PubMed
-
- Rajpara S, Botello A, Townend J, Ormerod A. Systematic review of dermoscopy and digital dermoscopy/artificial intelligence for the diagnosis of melanoma. British Journal of Dermatology. 2009;161(3):591–604. - PubMed
-
- Gonzalez SG, Gill M, Halpern A. Reflectance Confocal Microscopy of Cutaneous Tumors: An Atlas with Clinical, Dermoscopic and Histological Correlations. Informa Healthcare; London: 2008.
-
- Nori S, Rius-Díaz F, Cuevas J, Goldgeier M, Jaen P, Torres A, González S. Sensitivity and specificity of reflectance-mode confocal microscopy for in vivo diagnosis of basal cell carcinoma: A multicenter study. J. American Academy of Dermatol. 2004;51:923–930. - PubMed
Grants and funding
LinkOut - more resources
Full Text Sources
Other Literature Sources