

NMR characterization of general compartment size distributions
- PMID: 21709780
- PMCID: PMC3120057
- DOI: 10.1088/1367-2630/13/1/015010
NMR characterization of general compartment size distributions
Abstract
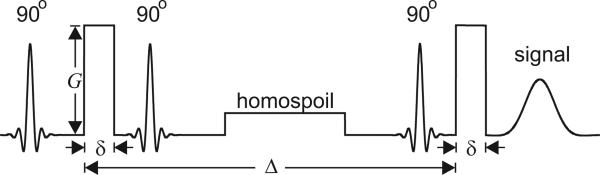
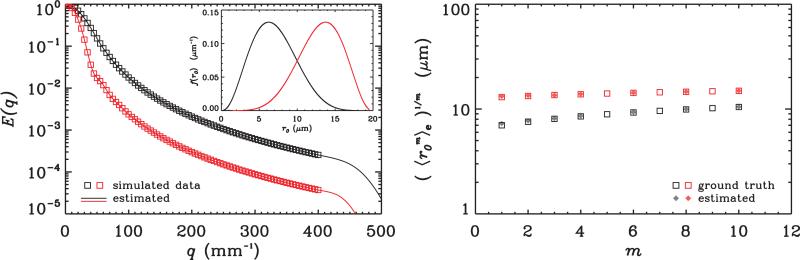
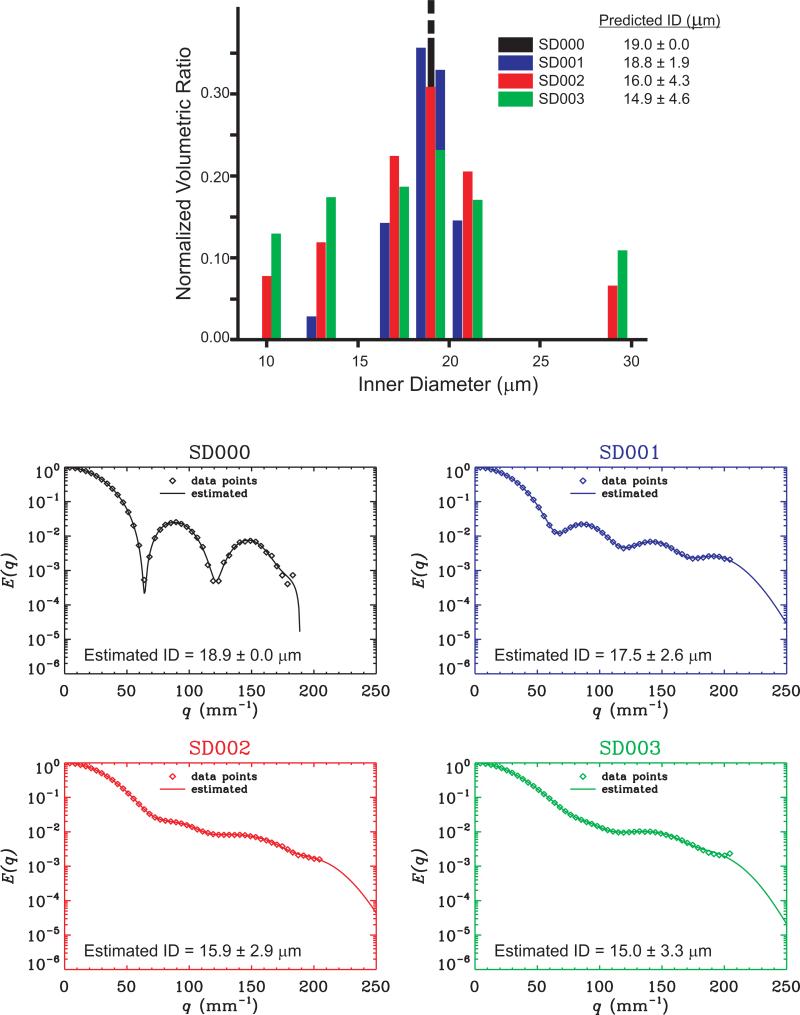
The influence of molecular diffusion on the nuclear magnetic resonance (NMR) signal can be exploited to estimate compartment size distributions in heterogeneous specimens. Theoretical relationships between the NMR signal intensity at long diffusion times and the moments of a general distribution of isolated pores with characteristic shapes (planar, cylindrical or spherical) are established. A numerical method based on expressing a general diffusion-attenuated NMR signal profile in a series of complete orthogonal basis functions is introduced and subsequently employed to estimate the moments of the compartment size distribution. The results on simulated and real data obtained from controlled water-filled microcapillaries demonstrate the power of the approach to create contrast based not only on the mean of the compartment size but also its variance. The technique can be employed to address a variety of problems such as characterizing distributions of droplet sizes in emulsions and of apparent axon diameters in nerve fascicles.
Figures
References
-
- Packer KJ, Rees C. Pulsed NMR studies of restricted diffusion I. droplet size distributions in emulsions. J Colloid Interface Sci. 1972;40:206–218.
-
- Callaghan PT, Jolley KW, Humphrey RS. Diffusion of fat and water in cheese as studied by pulsed field gradient nuclear magnetic resonance. J Colloid Interface Sci. 1983;93:521–529.
-
- van den Enden JC, Waddington D, van Aalst H, van Kralingen CG, Packer KJ. Rapid determination of water droplet size distributions by PFG-NMR. J Colloid Interface Sci. 1990;140:105–113.
-
- Li X, Cox JC, Flumerfelt RW. Determination of emulsion size distribution by NMR rest diffusion measurement. AIChE J. 1992;38:1671–1674.
-
- McDonald PJ, Ciampi E, Keddie JL, Heidenreich M, Kimmich R. Magnetic-resonance determination of the spatial dependence of the droplet size distribution in the cream layer of oil-in-water emulsions: Evidence for the effects of depletion flocculation. Phys. Rev. E. 1999;59:874–884.
Grants and funding
LinkOut - more resources
Full Text Sources