. 2011 May;5(4):220-40.
doi: 10.1186/1479-7364-5-4-220.

Inter-chromosomal variation in the pattern of human population genetic structure

Affiliations

Inter-chromosomal variation in the pattern of human population genetic structure

Tesfaye M Baye. Hum Genomics. 2011 May.

Abstract

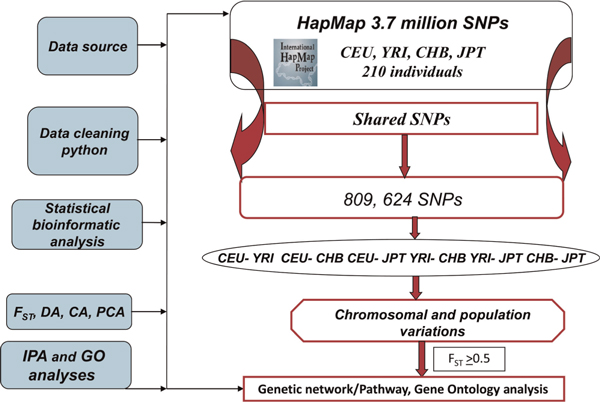
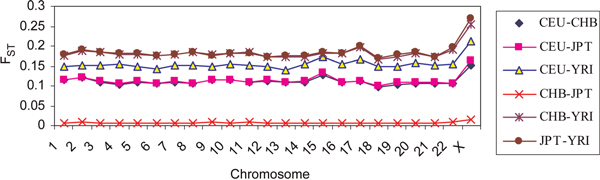
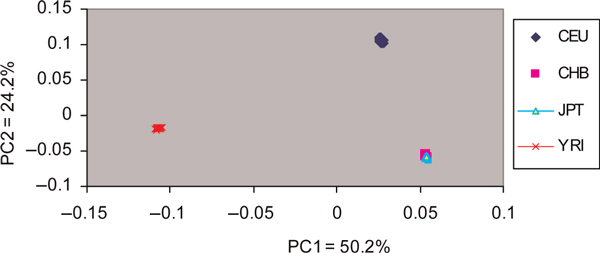
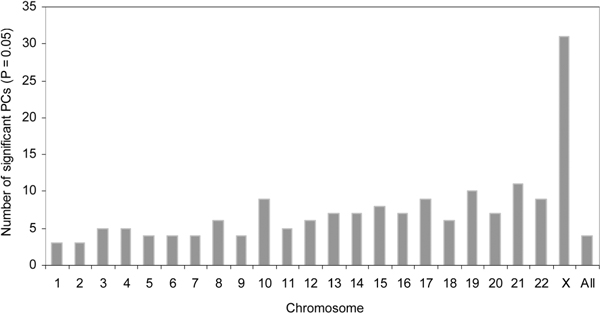
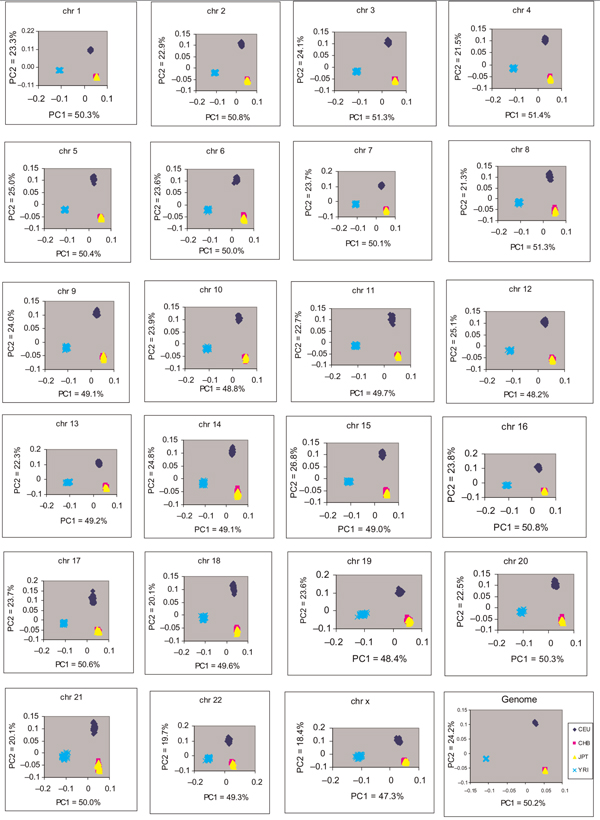
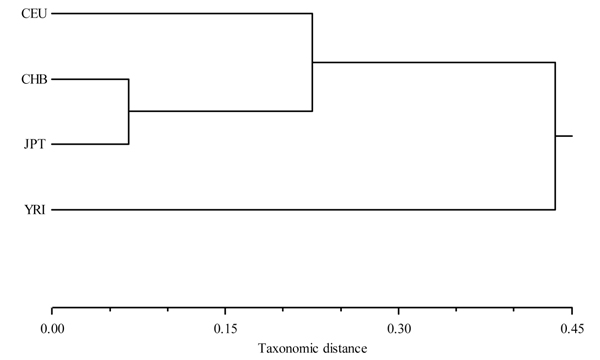
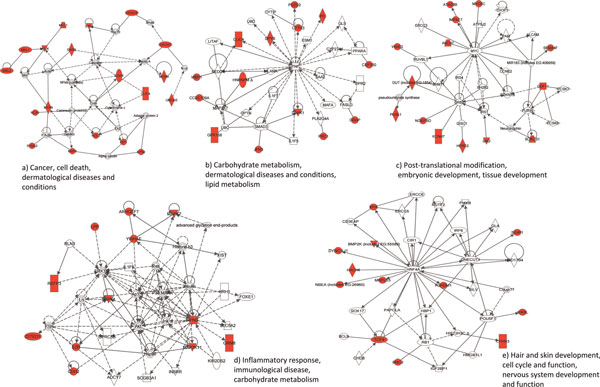
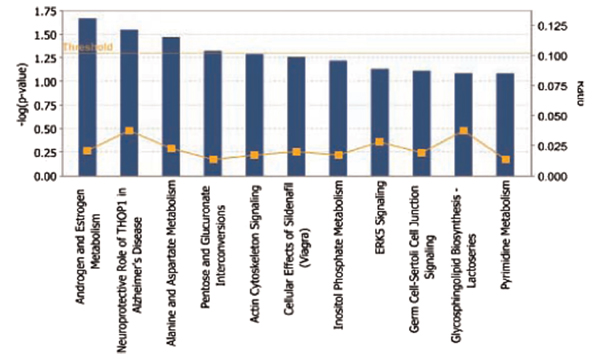
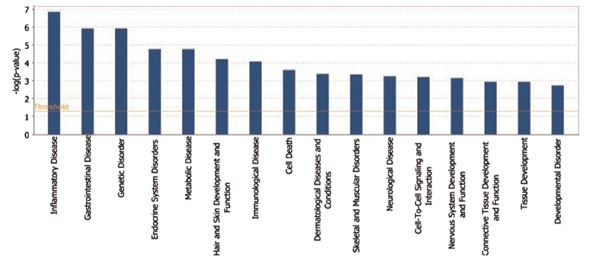
Emerging technologies now make it possible to genotype hundreds of thousands of genetic variations in individuals, across the genome. The study of loci at finer scales will facilitate the understanding of genetic variation at genomic and geographic levels. We examined global and chromosomal variations across HapMap populations using 3.7 million single nucleotide polymorphisms to search for the most stratified genomic regions of human populations and linked these regions to ontological annotation and functional network analysis. To achieve this, we used five complementary statistical and genetic network procedures: principal component (PC), cluster, discriminant, fixation index (FST) and network/pathway analyses. At the global level, the first two PC scores were sufficient to account for major population structure; however, chromosomal level analysis detected subtle forms of population structure within continental populations, and as many as 31 PCs were required to classify individuals into homogeneous groups. Using recommended population ancestry differentiation measures, a total of 126 regions of the genome were catalogued. Gene ontology and networks analyses revealed that these regions included the genes encoding oculocutaneous albinism II (OCA2), hect domain and RLD 2 (HERC2), ectodysplasin A receptor (EDAR) and solute carrier family 45, member 2 (SLC45A2). These genes are associated with melanin production, which is involved in the development of skin and hair colour, skin cancer and eye pigmentation. We also identified the genes encoding interferon-γ (IFNG) and death-associated protein kinase 1 (DAPK1), which are associated with cell death, inflammatory and immunological diseases. An in-depth understanding of these genomic regions may help to explain variations in adaptation to different environments. Our approach offers a comprehensive strategy for analysing chromosome-based population structure and differentiation, and demonstrates the application of complementary statistical and functional network analysis in human genetic variation studies.


Figures

Figure 1
Figure 1
Schematic presentation of single nucleotide polymorphism (SNP) mining, multivariate chromosomal and population diversity and network analysis strategies. There are ~3.7 million SNPs in the HapMap data release. Genotypes were summarised for each population. For each dataset, the number of alleles per locus (SNP) was coded to a string of numbers to obtain a full design matrix of alleles (the cells give the number of copies of each major allele for each individual: 0, 1 or 2). Two criteria were used to filter the SNPs included in the analysis: (i) locus call rate ≥ 95 per cent (ie we excluded all SNPs with more than 5 per cent missing data); and (ii) the SNP should be shared among populations, so that the same sets of SNPs were used throughout in the population comparisons. From the total of ~3.7 million SNPs in the HapMap data release, only 809,624 SNPs were eligible for analysis.
Figure 2
Figure 2
Pairwise FST chromosomal and population comparisons of the HapMap SNP dataset. A simple measure of population differentiation is Wright's FST, which measures the fraction of total genetic variation due to between-population differences. It could also represent a matrix of pairwise net distance (divergence) among the population.
Figure 3
Figure 3
Plot for the first two principal components (PCs) for HapMap individual for the genome-wide average shows the relationships between human populations in terms of their geographical origin. On a genome-wide average scale, about 74 per cent of the diversity in human population was explained on the basis of the first two PCs.
Figure 4
Figure 4
Significant numbers of PCs among chromosomes in the HapMap dataset. On a finer scale, the number of significant PCs that account for population differentiations vary from 2 to 31 among chromosomes.
Figure S1
Figure S1
Chromosome-wise principal component analysis (PCA) analysis of the entire HapMap dataset. The first PC accounted for more than double the variance of the second PC. The level of contribution of the first two PCs across chromosomes in classifying geographical regions are presented here. The chromosome-wise contribution of the first two PCs ranges from 65 per cent (Chr X) to 76 per cent (Chr 15). The contribution of PC1 ranges from 47 per cent (Chr X) to 51 per cent (Chr 3, Chr 8). The contribution of PC2 to the total variation ranges from 18 per cent (Chr X) to 27 per cent for Chr 15.
Figure S2
Figure S2
Unweighted pair-group method analysis dendrogram (a branching diagram used to show the relationships between members of a group) based on average taxonomic distance matrices among population means of HapMap SNP datasets. The cluster analysis (CA; constructed from principal components) for the mean of 210 individuals indicates the distance at which the various groups are formed and join together. CA, which is based on the means for all individuals from each geographical origin, was used to obtain similarities among individuals according to their correlation measures across all SNP datasets. Branch height represents dissimilarity. Note that, compared with YRI and CEU branch height, the CHB and JPT branch height is much shorter, representing that the genetic distance between these two populations is relatively close.
Figure 5
Figure 5
IPA network analysis for 126 genes mapped to significantly differentiated genomic regions. Genes with red nodes are focus genes in our analysis, the others are generated through the network analysis from the Ingenuity Pathways Knowledge Base (http://www.ingenuity.com). Edges are displayed with labels that describe the nature of the relationship between the nodes. The lines between genes represent known interactions, with solid lines representing direct interactions and dashed lines representing indirect interactions. Nodes are displayed using various shapes that represent the functional class of the gene product.
Figure S3
Figure S3
Global canonical pathways of the 126 genes linked to genomic regions of major population differentiation. The significance threshold, shown in yellow, represents a p value of greater than 0.05. The first four sets of functions shown represent a p-value of less than 0.01. Bars that are above the line indicate significant enrichment of a pathway.
Figure S4
Figure S4
The 16 most significant functional categories from IPA linked to the 126 genes of major population differentiation. The significance threshold, shown in yellow, represents a p value of greater than 0.05. Bars that are above the line indicate significant enrichment of a function.

References

    1. Mitchell-Olds T, Schmitt J. Genetic mechanisms and evolutionary significance of natural variation in Arabidopsis. Nature. 2006;441:947–952. doi: 10.1038/nature04878. - DOI - PubMed
    1. Alonso-Blanco C, Koornneef M. Naturally occurring variation in Arabidopsis: An underexploited resource for plant genetics. Trends Plant Sci. 2000;5:22–29. doi: 10.1016/S1360-1385(99)01510-1. - DOI - PubMed
    1. Risch N, Merikangas K. The future of genetic studies of complex human diseases. Science. 1996;273:1516–1517. doi: 10.1126/science.273.5281.1516. - DOI - PubMed
    1. Steinmetz LM, Mindrinos M, Oefner PJ. Combining genome sequences and new technologies for dissecting the genetics of complex phenotypes. Trends Plant Sci. 2000;5:397–401. doi: 10.1016/S1360-1385(00)01724-6. - DOI - PubMed
    1. Cavalli-Sforza LL, Feldman MW. The application of molecular genetic approaches to the study of human evolution. Nat Genet. 2003;33(Suppl):266–275. - PubMed

Publication types

MeSH terms

LinkOut - more resources