. 2011 Aug;108(2):391-404.
doi: 10.1093/aob/mcr143. Epub 2011 Jun 28.

Optimizing reproductive phenology in a two-resource world: a dynamic allocation model of plant growth predicts later reproduction in phosphorus-limited plants

Affiliations

Optimizing reproductive phenology in a two-resource world: a dynamic allocation model of plant growth predicts later reproduction in phosphorus-limited plants

Eric A Nord et al. Ann Bot. 2011 Aug.

Abstract

Background and aims: Timing of reproduction is a key life-history trait that is regulated by resource availability. Delayed reproduction in soils with low phosphorus availability is common among annuals, in contrast to the accelerated reproduction typical of other low-nutrient environments. It is hypothesized that this anomalous response arises from the high marginal value of additional allocation to root growth caused by the low mobility of phosphorus in soils.

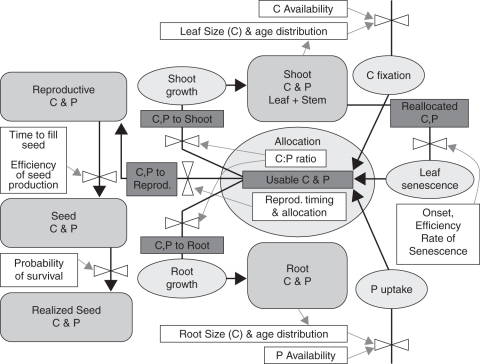
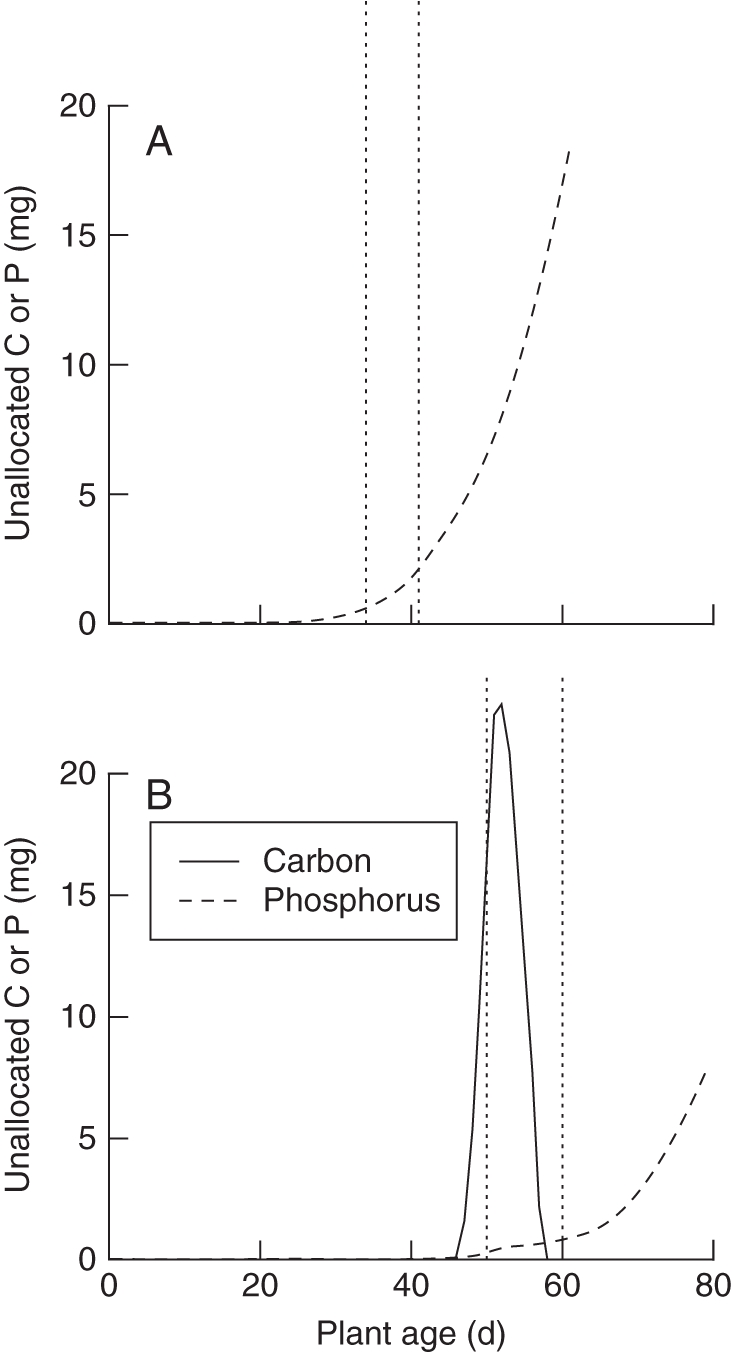
Methods: To better understand the benefits and costs of such delayed reproduction, a two-resource dynamic allocation model of plant growth and reproduction is presented. The model incorporates growth, respiration, and carbon and phosphorus acquisition of both root and shoot tissue, and considers the reallocation of resources from senescent leaves. The model is parameterized with data from Arabidopsis and the optimal reproductive phenology is explored in a range of environments.

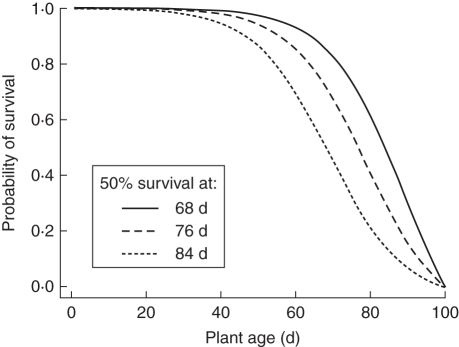
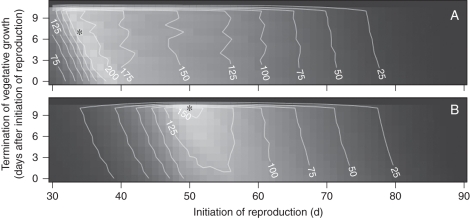
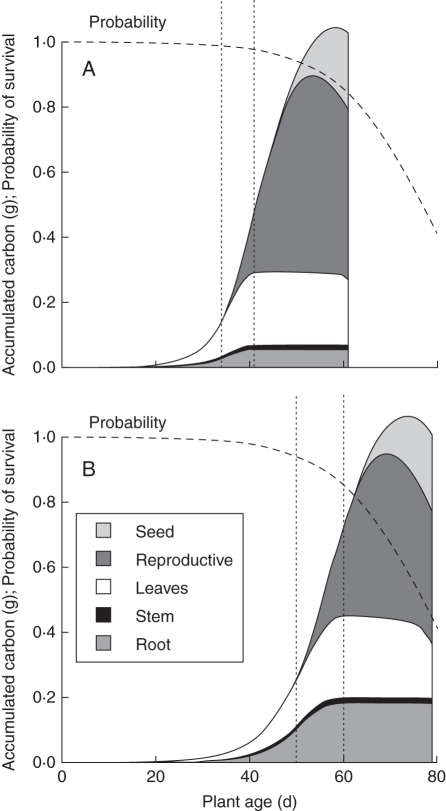
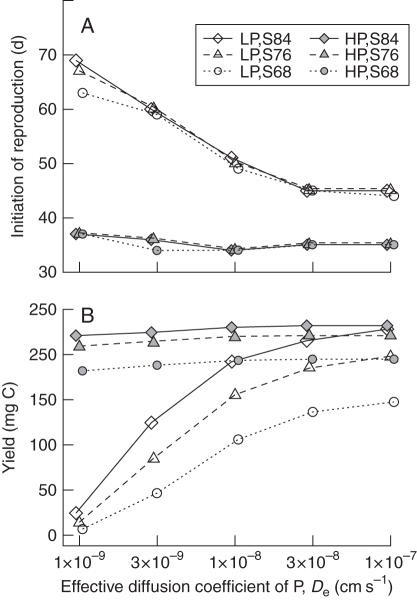
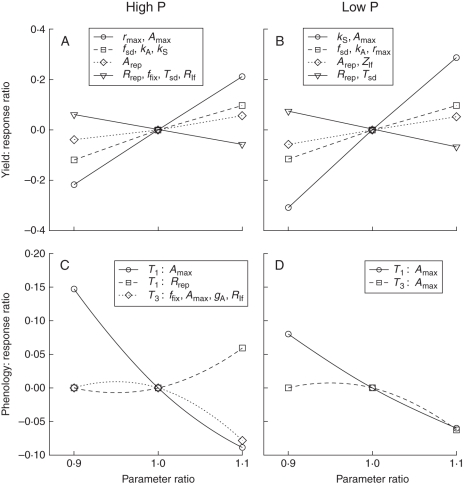
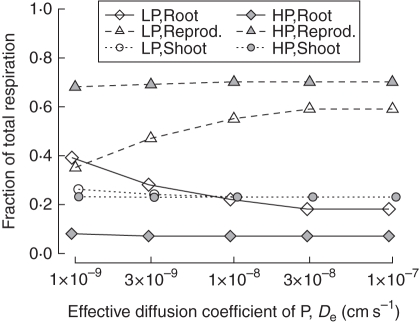
Key results: The model predicts delayed reproduction in low-phosphorus environments. Reproductive timing in low-phosphorus environments is quite sensitive to phosphorus mobility, but is less sensitive to the temporal distribution of mortality risks. In low-phosphorus environments, the relative metabolic cost of roots was greater, and reproductive allocation reduced, compared with high-phosphorus conditions. The model suggests that delayed reproduction in response to low phosphorus availability may be reduced in plants adapted to environments where phosphorus mobility is greater.

Conclusions: Delayed reproduction in low-phosphorus soils can be a beneficial response allowing for increased acquisition and utilization of phosphorus. This finding has implications both for efforts to breed crops for low-phosphorus soils, and for efforts to understand how climate change may impact plant growth and productivity in low-phosphorus environments.


Figures

Fig. 1.
Fig. 1.
Schematic of carbon and phosphorus pools (rounded rectangles) and flows (heavy black arrows with dark grey labels) in the model, as described in the text. Major processes are denoted as ovals, flows of information are shown as light grey arrows, and controls are shown as valves.
Fig. 2.
Fig. 2.
Three survival scenarios used in the sensitivity analysis, with 50 % probability of survival to 68, 76 and 84 d.
Fig. 3.
Fig. 3.
The effect of reproductive phenology on seed production (seed carbon) of simulated Arabidopsis in high-phosphorus (A) and low-phosphorus (B) conditions. Increasing seed production is shown as increasing lightness, and the contour interval is 25 mg. Optimal phenology (indicated by *) occurred on a relatively smooth peak, which was later and lower in low phosphorus than in high. Termination of vegetative growth was constrained to be within 10 d of initiation of reproduction.
Fig. 4.
Fig. 4.
Allocation and growth as simulated by the model in two scenarios: (A) 20 µm (high) phosphorus and (B) 1 µm (low) phosphorus. These are based on the standard parameters (Table 3), with De = 1·0 × 10−8 cm2 s−1, and optimal phenology. The dashed curve represents the probability of survival to a given age for scenario S76. The vertical dotted lines represent the initiation of reproduction and termination of vegetative growth from the optimal phenology. With high phosphorus the optimal phenology was: initiate reproduction at 34 d and terminate vegetative growth at 41 d. With low phosphorus these values were 50 and 60 d. Delaying reproduction in low phosphorus permitted enough additional phosphorus accumulation to offset the reduced probability of survival. Plants in low phosphorus can reach a similar size to those in high phosphorus, but are less likely to survive long enough to do so.
Fig. 5.
Fig. 5.
Unallocated carbon and phosphorus as simulated by the model in (A) 20 µm (high) phosphorus and (B) 1 µm (low) phosphorus. Unallocated carbon and phosphorus (as indicated) accumulate after reproductive growth begins, because the plant has fewer resources to allocate to vegetative growth and so is less able to balance acquisition of resources. Unallocated resources from one time step are allocated in the following time step. The vertical dotted lines represent the initiation of reproduction and termination of vegetative growth from the optimal phenology.
Fig. 6.
Fig. 6.
Effect of probability of survival and phosphorus diffusivity on optimal age of initiation of reproduction (A) and yield (B) for simulated Arabidopsis in low (1 µm; LP) and high (20 µm; HP) phosphorus. Simulations were carried out over a range of values of the effective phosphorus diffusion coefficient (De; 1·0 × 10−9 to 1·0 × 10−7 cm2 s−1, or 8·64 × 104 to 8·64 × 106 μm2 d−1) and with 3 survival scenarios with 50 % probability of surviving to: 84, 76 or 68 d (S84, S76 and S68). Survival scenario affected yield more than phenology. De affected both yield and phenology in low phosphorus, but had little effect in high phosphorus.
Fig. 7.
Fig. 7.
Sensitivity of yield (A, B) and phenology (C, D) to variation of input parameters for simulated growth with 20 µm (high) phosphorus (A, C) and 1 µm (low) phosphorus (B, D). The parameter ratio (on the abcissa) is the ratio of the parameter value used to the base parameter value (Table 3). For brevity, parameters with similar responses have been grouped together. The ordinate in all panels is the fractional difference in the response (fractional difference of 0·3 = 30 % increase). Parameter names and values are listed in Table 3.
Fig. 8.
Fig. 8.
Phosphorus diffusivity affects respiration of the organ classes as a fraction of total respiration in simulated Arabidopsis in low (1 µm; LP) and high (20 µm; HP) phosphorus. Simulations were carried out over a range of values of the effective phosphorus diffusion coefficient (De; 1·0 × 10−9 to 1·0 × 10−7 cm2 s−1, or 8·64 × 104 to 8·64 × 106 μm2 d−1) with 50 % probability of surviving to 76 d (S76). In both high and low phosphorus, shoot respiration was fairly constant. In low phosphorus, root respiration was relatively greater at lower levels of De, and this was offset by reduced respiration of reproductive tissue.

References

    1. Aerts R. Nutrient resorption from senescing leaves of perennials: are there general patterns? Journal of Ecology. 1996;84:597–608.
    1. Aerts R, Chapin FS. The mineral nutrition of wild plants revisited: a re-evaluation of processes and patterns. Advances in Ecological Research. 2000;30:1–67.
    1. Aerts R, Bakker C, de Caluwe H. Root turnover as a determinant of the cycling of C, N, and P in a dry heathland ecosystem. Biogeochemistry. 1992;15:175–190.
    1. Amir S, Cohen D. Optimal reproductive efforts and the timing of reproduction of annual plants in randomly varying environments. Journal of Theoretical Biology. 1990;147:17–42.
    1. Amthor JS. Respiration and crop productivity. New York, NY: Springer-Verlag; 1989.

Publication types